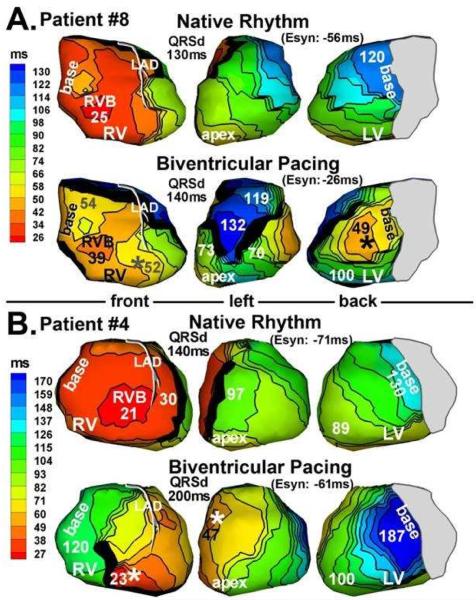
Figure 6.
Activation maps from 2 patients (panel A and panel B) who did not respond to CRT. Native rhythm (top) and BiV pacing (bottom) maps are shown for each patient. Format is similar to that in Figure 3. Pacing sites are marked by asterisks. (From Jia P, Ramanathan C, Ghanem RN, Ryu K, Varma N, Rudy Y. Electrocardiographic imaging of cardiac resynchronization therapy in heart failure: observations of variable electrophysiologic responses. Heart Rhythm.2006;3:296–310; with permission.)

