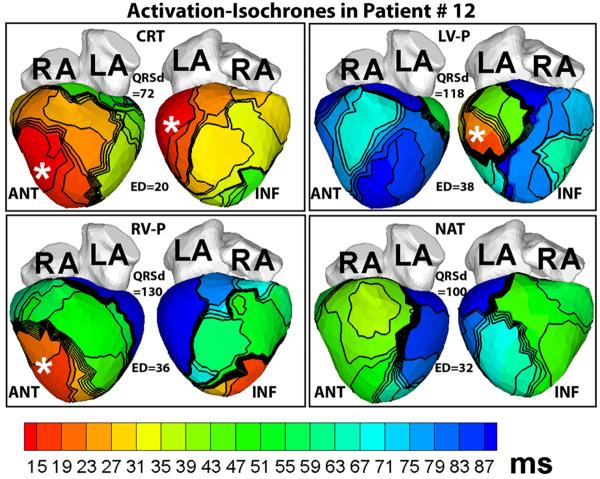
Figure 7.
Activation maps in a patient who had a normal QRSd despite LBBB pattern before implant. Note the large electrical dyssynchrony (ED = 32ms) in the native rhythm (NAT panel) in spite of a normal QRS duration (QRSd = 100ms). Cardiac resynchronization therapy (CRT panel) restored electrical synchrony (ED = 20ms) in the normal range. Pacing sites are indicated by asterisks. Each panel shows anterior (ANT, left) and inferior (INF, right) four-chamber views. RV-P and LV-P indicate RV pacing only or LV pacing only, respectively. (From Ghosh S, Silva JN, Canham RM, et al. Electrophysiologic substrate and intra¬ventricular left ventricular dyssynchrony in nonischemic heart failure patients undergoing cardiac resynchronization therapy. Heart Rhythm 2011;8:692–699; with permission.)

