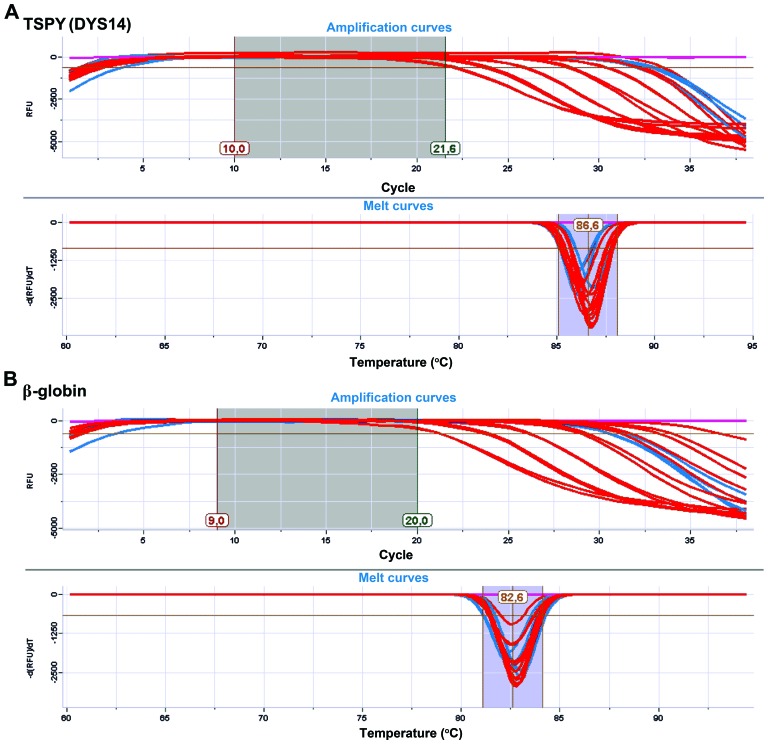
Figure 2.
Representative amplification plots (upper panels) and melt curves (lower panels) for the markers, (A) TSPY (DYS14) and (B) β-globin. The amplification plots show the relative fluorescence units (RFU) at each cycle of the reaction. Red lines represent the standard samples (7- to 5-fold serial dilutions, ranging from 460 to 0.029 ng), and the light blue lines represent two indicative unknown samples. The negative controls (NTCs) are depicted in purple. The absence of secondary peaks in the melt plot, confirms the specificity of the primers used (courtesy of Dr A. Zaravinos).

