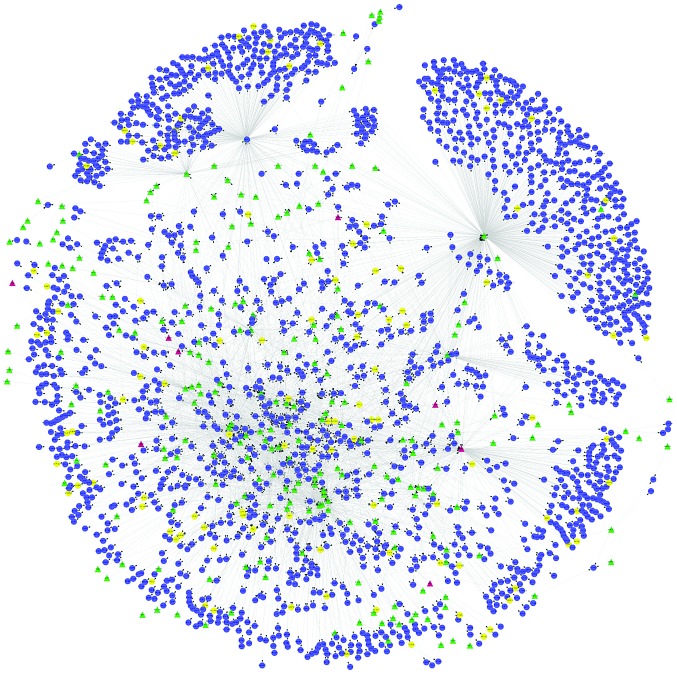
Figure 3.
Transcriptional regulation network of genes from the gene expression profile of glioblastomas. The triangles represent differentially expressed transcription factors (TFs) (red, differential expression; green, expression without difference). The yellow circles represent differentially expressed genes (DEGs) regulated by TFs (yellow, DEGs; blue, expression without difference).

