
Figure 5.
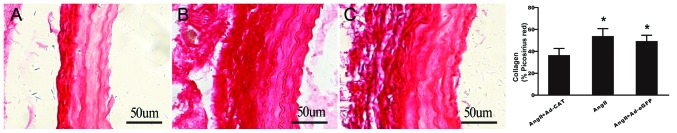
Collagen contents of the left common carotid arteries in each group were determined using picrosirius red staining. Collagen content following treatment with (A) AngII+Ad-CAT-eGFP, (B) AngII only and (C) AngII+Ad-eGFP (magnification, ×200). The bar graphs in the panel on the right show the quantified data. Values are presented as the mean ± standard deviation (n=4–6). *P<0.05 vs. AngII+Ad-CAT. eGFP, enhanced green fluorescent protein; CAT, catalase; ad, adenovirus; AngII, angiotensin II.