FIG 1.
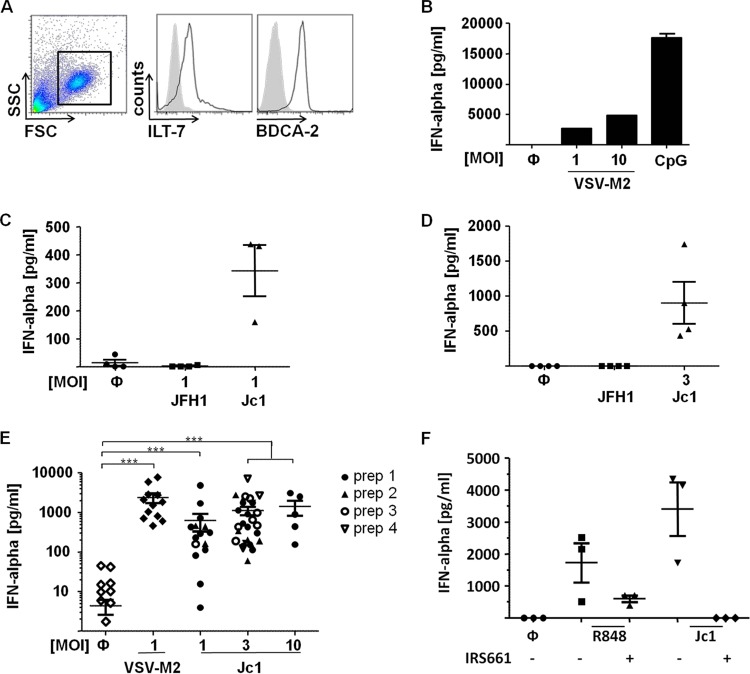
pDC stimulated with crude preparations of HCV strain Jc1, but not HCV strain JFH1, mount IFN-α responses. (A) MACS-purified pDC, as used throughout this study, were stained with BDCA-2- and ILT-7-specific antibodies and FACS analyzed. FSC, forward scatter; SSC, side scatter. Live cells were gated (boxed area), and the expression of ILT-7 and BDCA-2 (black line) was plotted against unstained samples (shaded curve). (B) pDC isolated from one donor were stimulated with VSV-M2 at the indicated MOI, with CpG (1 μM) or left untreated (Ф). After 18 h of incubation, IFN-α was determined in the cell-free supernatant by an ELISA method. The error bars indicate standard errors of the mean (SEM). (C) pDC were stimulated with crude preparations of HCV strain JFH1 or Jc1 at an MOI of 1 and analyzed as for panel B. (D) pDC were stimulated with crude preparations of JFH1 or Jc1 preparations normalized for equal viral RNA contents, which were equivalent to Jc1 at an MOI of 3. After 18 h of incubation, IFN-α was assessed in the supernatant by an ELISA method. Experiments with pDC isolated from at least three different donors are shown (pDC, n = 3) in panels C and D. (E) pDC were stimulated with VSV-M2 or four different crude preparations of Jc1 at the indicated MOI. After 18 h of incubation, IFN-α was assessed in the supernatant by an ELISA method. pDC were from 5 to 35 donors. ***, P < 0.0001 (Kruskal-Wallis test with Dunn's multiple-comparison test). (F) pDC were pretreated with the TLR7 inhibitor IRS661 (0.175 μM) for 30 min before stimulation with either the TLR7 stimulus R848 (0.5 μg/ml) or Jc1 at an MOI of 3. After 18 h, IFN-α production was assessed in the supernatant by an ELISA method (pDC, n = 3).

