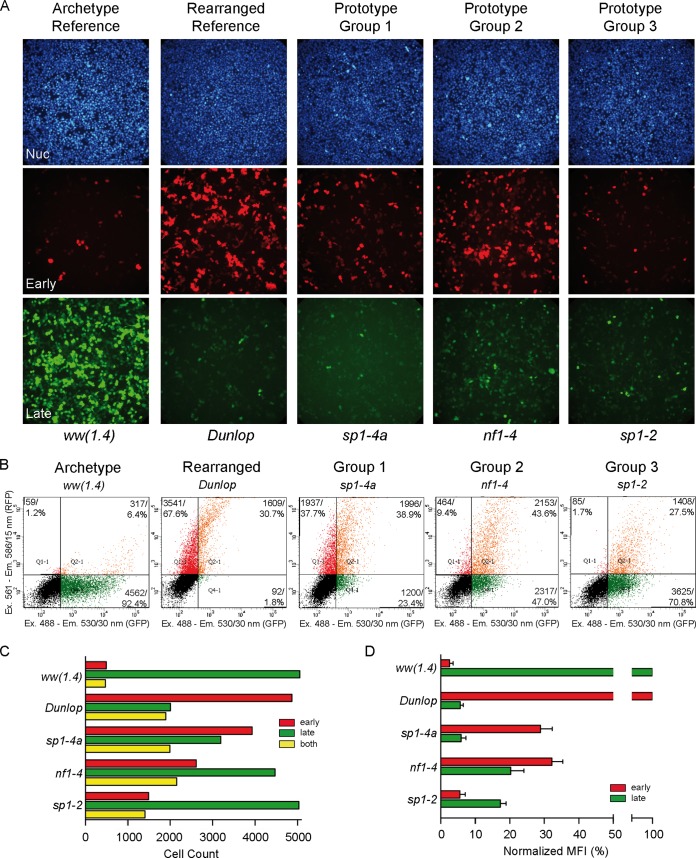
FIG 3.
Phenotypic characterization of NCCR point mutations. (A) The indicated constructs were transfected into HEK293 cells, and fluorescence images (20× objective) were taken 2 days posttransfection (dpt). The archetype ww(1.4) strain and the Dunlop strain served as references. The group 1 prototype is sp1-4a (high early and low late expression), the group 2 prototype is nf1-4 (intermediate to high early and intermediate late expression), and the group 3 prototype is sp1-2 (low early and low to intermediate late expression). (B) Plots of representative FACS measurements of indicated NCCRs in HEK293 at 2 dpt as described in Fig. 1. (C) Cell counts of red, green, and double-positive cells. (D) Weighted mean fluorescence intensity (MFI) (Fig. 1).

