
FIG 8.
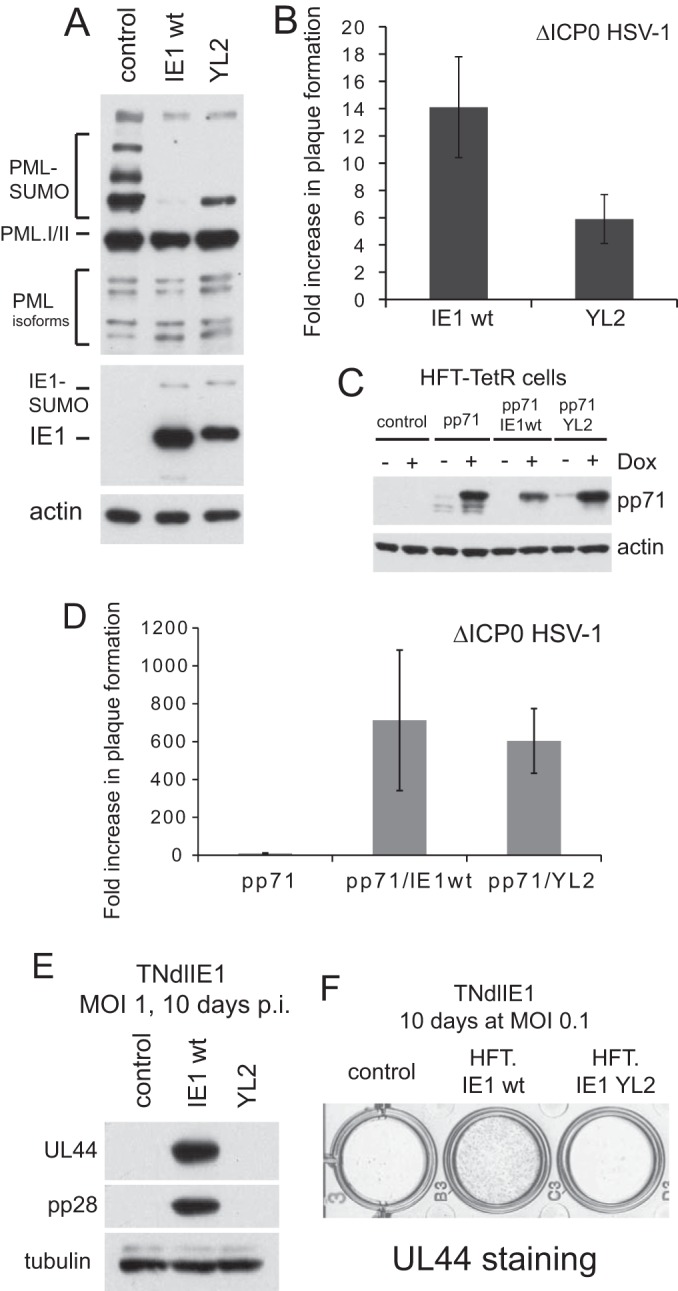
Confirmation of the phenotype and further analysis of mutant YL2. (A) Western blot analysis of PML, IE1, and actin expression in induced HFT-TetR-IE1 wt and HFT-TetR-YL2 cells compared with HFT-TetR control cells. (B) Fold increases in plaque formation of ICP0 null mutant HSV-1 in HFT-TetR-IE1 wt and HFT-TetR-YL2 cells compared to control HFT-TetR cells. The mean of two independent experiments is presented, with the error bars showing the range of values obtained in the two experiments. (C) Expression of pp71 in HFT-TetR, HFT-TetR-IE1 wt, and HFT-TetR-YL2 cells after additional transduction of these cells with a lentiviral vector expressing myc pp71. (D) Fold increases in plaque formation of ICP0 null mutant HSV-1 in HFT-TetR-pp71/IE1 wt and HFT-TetR-pp71/YL2 cells compared to control HFT-TetR-pp71 cells. The mean of two independent experiments is presented, with the error bars showing the range of values obtained in the two experiments. The increase in plaque formation of the mutant virus in HFT-TetR-pp71 cells over control HFT-TetR cells was 9.5-fold ± 3.1-fold. (E) Expression of UL44 and pp28 after infection of induced control (HFT-TetR), HFT-TetR-IE1 wt, and HFT-TetR-YL2 cells with TNdlIE1. (F) Immunohistochemical staining of UL44 expression in cultures of induced control (HFT-TetR), HFT-TetR-IE1 wt, and HFT-TetR-YL2 cells with TNdlIE1. p.i., postinfection.