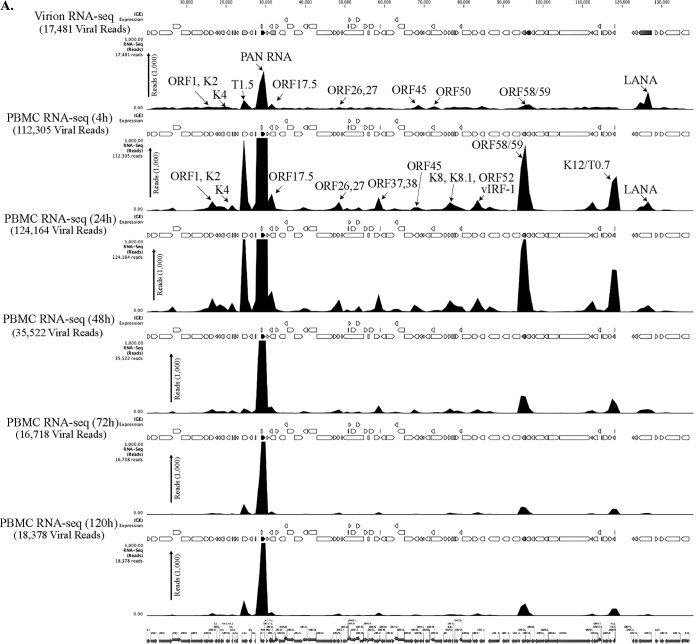
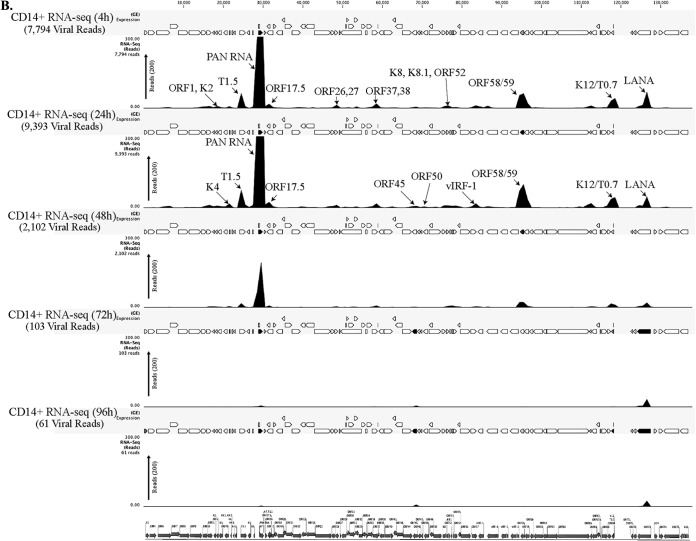
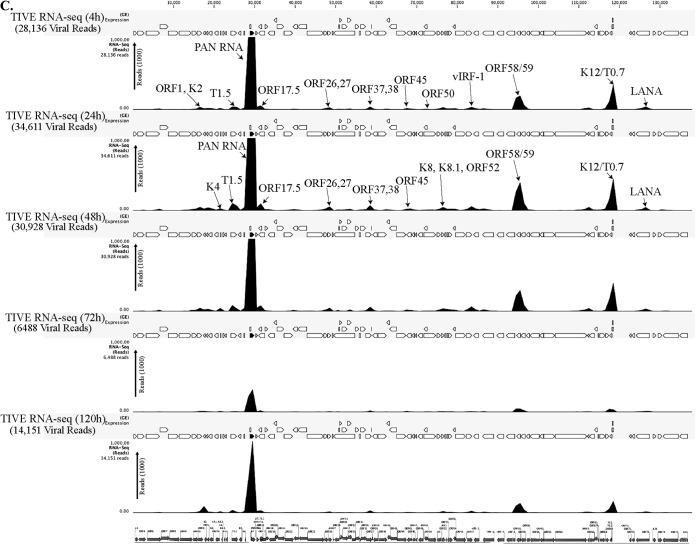
FIG 2.
(A) Transcriptome analysis of KSHV during de novo infection of human PBMCs. Total RNAs extracted from de novo-infected PBMCs harvested at 4 h, 24 h, 48 h, 72 h, and 120 h postinfection were subjected to cDNA library preparation using a TrueSeq RNA-seq library kit. The libraries were sequenced using HiSeq, and the sequences were mapped to the reference KSHV genome to determine the relative abundance of viral transcripts. Purified virions treated with micrococcal nuclease to eliminate nucleic acid contamination were subjected to total RNA extraction. RNA treated with DNase was used for sequencing after cDNA library preparation. The number of transcripts mapping to the viral genome is shown in parentheses in each panel. The peak height represents the number of reads for the indicated genes, and the predominant peaks are marked in virion RNA-seq and 4-h-postinfection samples. PAN RNA showed the highest peak in virions as well as KSHV-infected PBMCs. The bottom panel shows the locations of KSHV genes on the coordinates. (B) Transcriptome analysis of de novo-infected CD14+ cells. Total RNAs extracted from de novo-infected CD14+ cells harvested at 4 h, 24 h, 48 h, 72 h, and 96 h postinfection were subjected to cDNA library preparation using a TrueSeq RNA-seq library kit. The libraries were sequenced using HiSeq, and the sequences were mapped to the reference KSHV genome to determine the relative abundance of viral transcripts. The number of transcripts mapping to the viral genome is shown in parentheses in each panel. The peak heights representing the number of reads for the indicated genes are marked in 4-h-postinfection and 24-h-postinfection samples. PAN RNA showed the highest peak until 48 h postinfection, followed by a decline to very low levels. LANA expression progressively increased, showing establishment of latency. The bottom panel shows the locations of KSHV genes on the coordinates. (C) Transcriptome analysis of de novo-infected TIVE cells. Total RNAs extracted from de novo-infected TIVE cells harvested at 4 h, 24 h, 48 h, 72 h, and 120 h postinfection were subjected to cDNA library preparation using a TrueSeq RNA-seq library kit. The libraries were sequenced using HiSeq, and the sequences were mapped to the reference KSHV genome to determine the relative abundance of viral mRNA. The numbers of transcripts mapping to the viral genome are shown in parenthesis on each panel. The peak heights representing the number of reads for the indicated genes are marked in 4-h-postinfection and 24-h-postinfection samples. The sample from 72 h postinfection showed lower peaks because of the lower number of total reads, which were normalized by calculating the RPKM values in the heat maps. The bottom panel shows the locations of KSHV genes on the coordinates.


