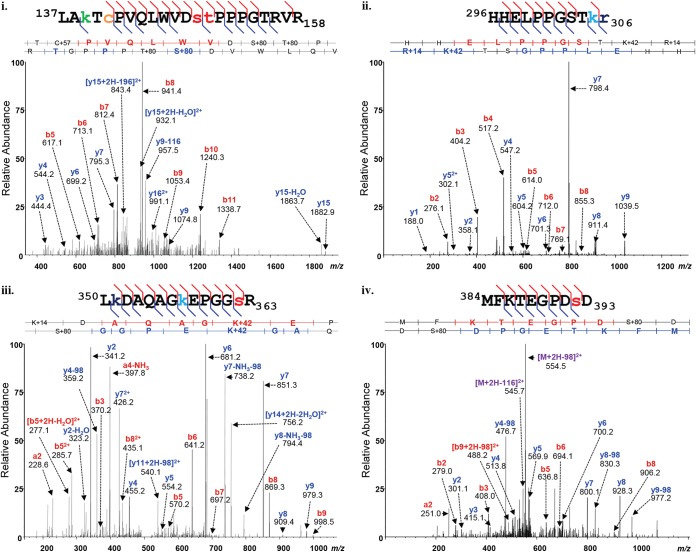
FIG 3.
MS-MS spectra of p53 isolated from AdEasyE1Δ2347-dl341-infected cells. The p53 protein was isolated from double-mutant-infected cells and subjected to protease digestion as described in Materials and Methods. The peptides were analyzed using reversed-phase nano-UPLC-MS and MS-MS on an LTQ Orbitrap Velos MS platform. Shown are representative examples of tandem mass spectra displaying the assignment of fragment ions, which are labeled with their empirically determined m/z values and b- and y-ion designations. The matched peptide sequences are shown above the spectra, with the PTMs detected color coded as follows; phosphorylation, red; acetylation, green; monomethylation, navy; trimethylation, turquoise; and carbamidomethylation, orange.

