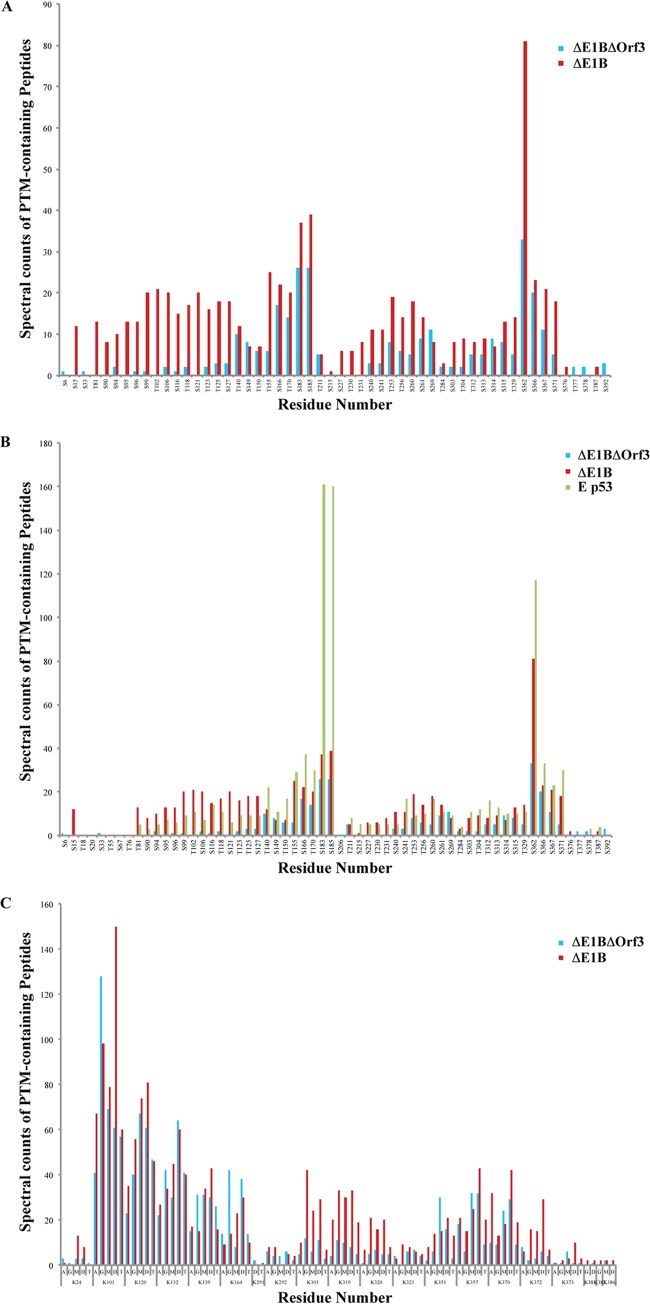
FIG 4.
Comparison of the posttranslational modification profiles of ΔE1B p53 and ΔE1B/ΔOrf3 p53. Peptides from populations of ΔE1B/ΔOrf3 p53 were subjected to nano-UPLC-MS and MS-MS analyses on the LTQ Orbitrap Velos MS platform. Modification profiles were generated from triplicate LC-MS runs for each sample by spectral counting, as described previously (81). (A and C) Modification profiles for phosphorylation of Ser and Thr residues (A) and acetylation (A), ubiquitinylation (G), and mono-, di-, and trimethylation (M, D, and T, respectively) of Lys residues (C), which are compared to those of ΔE1B p53 (81). (B) Phosphorylation profiles of the two p53 populations compared to that of p53 isolated from etoposide-treated (E p53) cells reported previously in Molecular and Cellular Proteomics (81).

