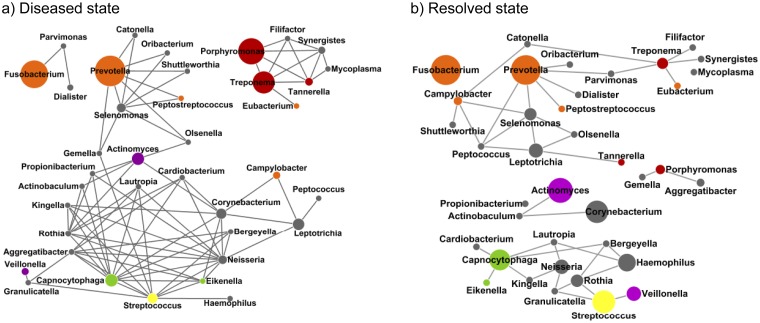
FIG 4 .
Microbial cooccurrence in the subgingival microbiome. Cooccurrence networks were constructed on the basis of the relative abundance profiles of subgingival microorganisms in the diseased state (a) and in the resolved state (b). Each node represents a genus and is colored according to the bacterial complex designations of Socransky et al. (13). The gray nodes represent the organisms that were not classified by Socransky et al. The sizes of the nodes are proportional to the average relative abundances of the genera (if >1%) in each state. Each edge represents a positive correlation between the two genera with a Pearson’s correlation coefficient of >0.4 (26).

