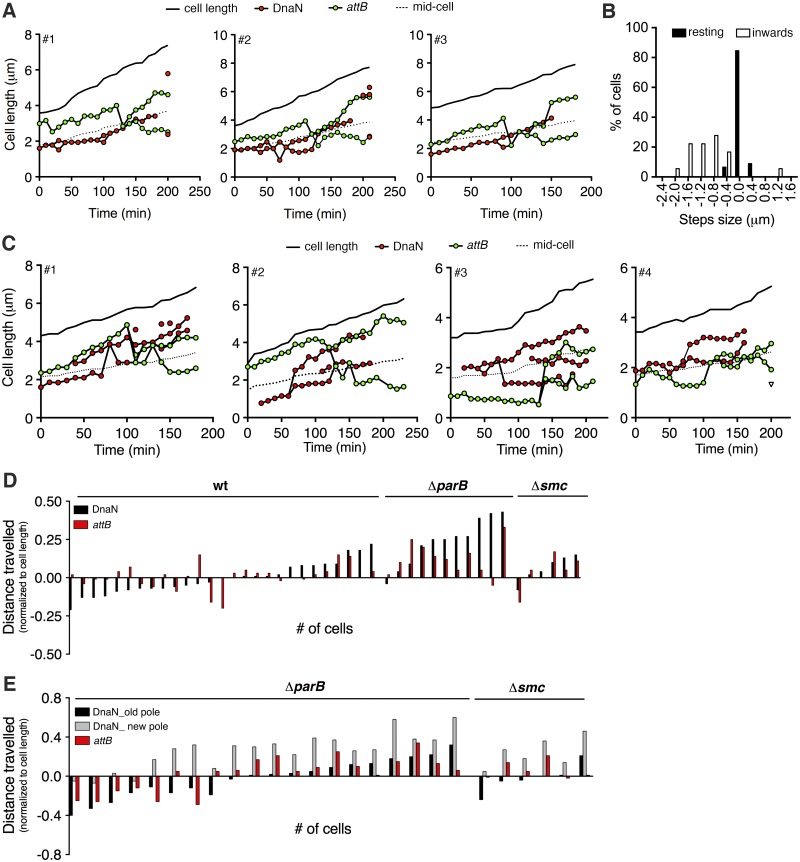
FIG 5 .
Altered movement of mCherry-DnaN and FROS-attB foci in ParB- and SMC-deficient cells. (A) Three representative time traces of positions of mCherry-DnaN (red circles) and FROS-attB (green circles) foci relative to the old cell pole. Images were recorded at 10-min intervals. Solid line, cell length; dotted line, midcell. See also Fig. S3B in the supplemental material. (B) Distribution of step sizes of FROS-attB foci. Images were recorded at 2-min intervals. Black bars, distribution of steps during the resting period prior to movement toward the replisome (n = 168). White bars, distribution of steps during movement toward replisome (n = 18). (C) Four representative time traces of positions of mCherry-DnaN (red circles) and FROS-attB (green circles) foci relative to the old cell pole in ΔparB cells. Images were recorded at 10-min intervals. Solid line, cell length; dotted line, midcell. See also Fig. S3B in the supplemental material. (D) Net movement of mCherry-DnaN foci (black bar) relative to FROS-attB foci (red bars) during the 90-min period after the first appearance of the replisome in wild-type, ΔparB, and Δsmc cells with unsplit mCherry-DnaN foci. (E) Net movement of mCherry-DnaN foci (grey and black bars) relative to FROS-attB foci (red bars) during the 90-min period after the first appearance of the replisome in wild-type (wt), ΔparB, and Δsmc cells with split mCherry-DnaN foci that move independently.

