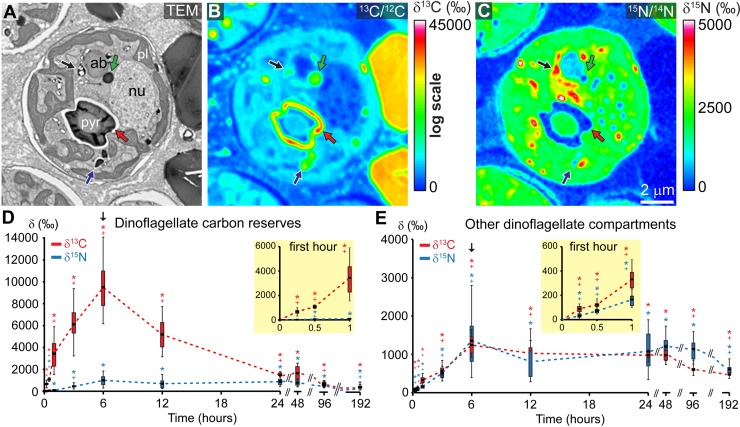
FIG 1 .
Photosynthesis-dependent carbon and nitrogen assimilation and turnover in dinoflagellate endosymbionts. (A) TEM micrograph of a representative dinoflagellate cell within the coral oral gastroderm after 6 h in the pulse of dual isotopic labeling under light with [13C]bicarbonate (2 mM) and [15N]nitrate (30 µM). (B and C) Corresponding NanoSIMS 13C/12C (B) and 15N/14N (C) isotopic images. (D and E) NanoSIMS quantified 13C/12C (in red) and 15N/14N (in blue) isotope ratios in the dinoflagellate C reserves (including lipid droplets and starch granules) and in the remaining dinoflagellate compartments, respectively, during the pulse-chase experiment conducted for 8 days under light/dark cycling (12 h/12 h). The black arrow on graphs indicates the end of the 6-h pulse of labeling under light. Significant differences (pairwise Wilcoxon rank sum test or pairwise t test, P < 0.05) are indicated between labeled and unlabeled control corals (*) and between samples from two consecutive time points (+); the number of replicate ROIs and P values of statistical analyses are given in Data Set S1 in the supplemental material; the box-whisker plot separates data into quartiles, with the top of the box defining the 75th percentile, the bottom the 25th percentile, the middle line the average value, the upper “whisker” the 95th percentile, and the lower “whisker” the 5th percentile. ab, accumulation body; nu, nucleus; pl, plastid; pyr, pyrenoid; red arrows, primary starch; blue arrows, secondary starch; green arrows, dinoflagellate LDs; black arrows, vesicles containing uric acid crystals.

