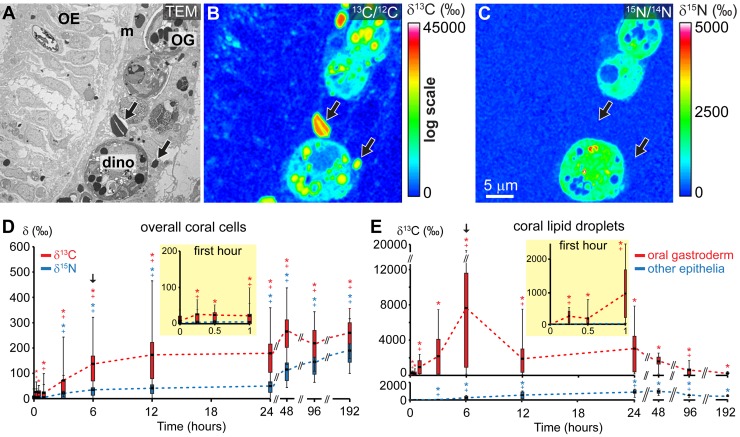
FIG 2 .
Photosynthate translocation from dinoflagellates into the coral host tissue and their lipid droplets. (A) Representative TEM micrograph of the coral oral tissue after 6 h in the pulse of dual isotopic labeling under light. (B and C) Corresponding NanoSIMS 13C/12C (B) and 15N/14N (C) isotopic images. (D) NanoSIMS quantified 13C/12C (in red) and 15N/14N (in blue) isotopic ratios in the whole coral tissue (including all four epithelia) during the pulse-chase experiment under light/dark cycling. (E) NanoSIMS quantified 13C/12C isotopic ratio in coral lipid droplets from the oral gastroderm (in red) and from the three other epithelia (oral epiderm, aboral gastroderm, and calicoderm [in blue]). Results and their statistical significance are reported as described in the legend to Fig. 1. OE, oral epiderm; OG, oral gastroderm; m, mesoglea; dino, dinoflagellate cell; black arrows, coral lipid droplets.

