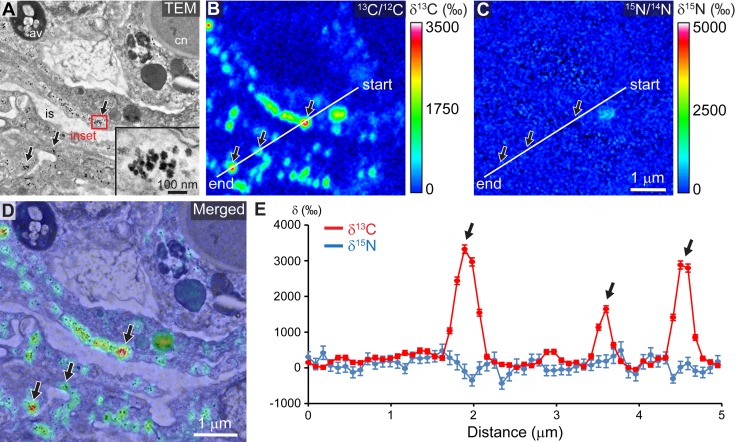
FIG 3 .
Photosynthate accumulation into coral glycogen granules. (A) Representative TEM micrograph of the coral oral epiderm with a higher-magnification view of glycogen granules (inset). (B and C) Corresponding NanoSIMS 13C/12C (B) and 15N/14N (C) isotopic images. (D) Merged image between the TEM micrograph and the NanoSIMS 13C/12C isotopic map. An enlarged view is provided in Fig. S7 in the supplemental material. (E) Fluctuations of both 13C (in red) and 15N (in blue) enrichments along the NanoSIMS profile depicted in panels B and C. Standard deviations of the mean are based on Poisson statistics. Black arrows point to areas rich in glycogen granules. av, autophagic vacuole; cn, cnidocyte; is, intercellular space.

