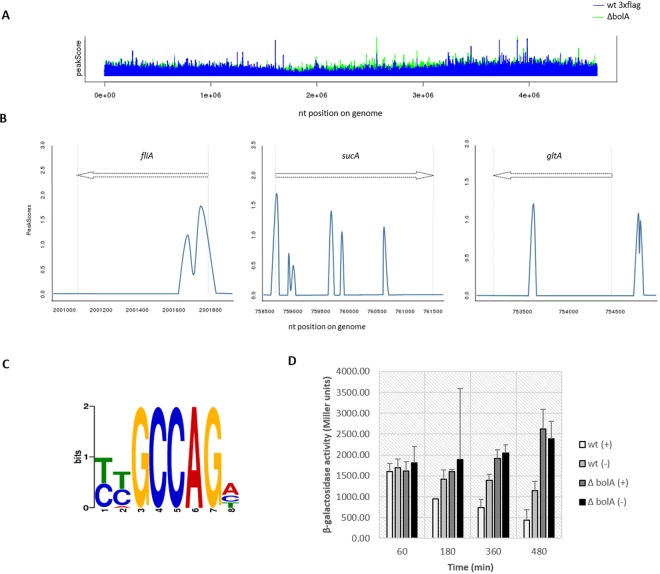
FIG 4 .
Graphical representation of the BolA ChIP-seq results, DNA consensus sequence, and its effect on the transcription of downstream genes. (A) Statistically significant peaks detected for wt 3×Flag and ΔbolA strains. For data processing, the ΔbolA strain was considered the background and subtracted from the wt 3×Flag sample. (B) Graphical representation of the peaks associated with three different targets determined by ChIP-seq. BolA binding regions are spread in the chromosome, not only at the 5′ untranslated region (UTR), but also along the ORFs. (C) The BolA consensus was determined based on the pool of DNA sequences corresponding to the identified peaks. The statistical significance of the consensus obtained is associated with a P value of 6.1 × 10⁻³. (D) Graphic showing the β-galactosidase activity of a construct with the mreBCD promoter region containing the consensus sequence and a second construct without it. The plus sign represents the extracts where the consensus was present, while the minus sign indicates the absence of the consensus. The experiment was performed in the wt and the ΔbolA backgrounds. In agreement with the BolA-dependent mreB downregulation, when the consensus sequence is not present, an increased activity of β-galactosidase can be observed, strengthening the importance of the consensus for the proper BolA-dependent regulation. Additionally, in the ΔbolA background, there are no significant differences between the two extracts, excluding the hypothesis of a construct-dependent effect.

