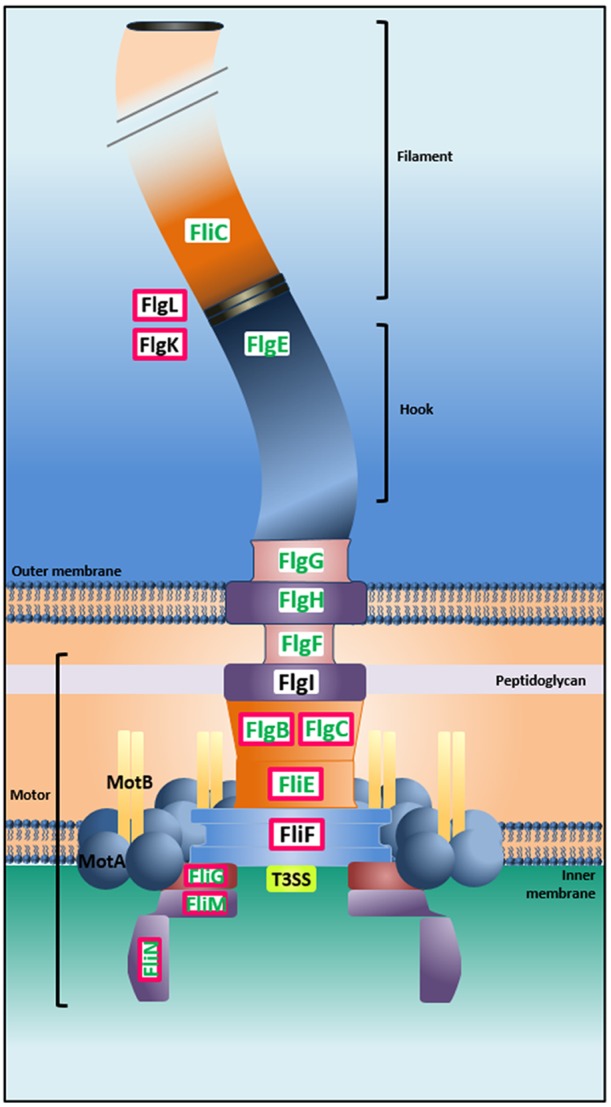
FIG 5 .

Representative flagellar structure and related proteins coupled with microarrays and ChIP-seq analysis results. ChIP-seq analysis showed the capacity of BolA to directly interact with different genes encoding proteins involved in diverse steps of the flagellar biosynthesis pathway. Of the 33% negatively regulated genes related with the flagellar structure (bolA++/ΔbolA ratios), 45% were identified as direct BolA targets (the proteins in pink boxes are encoded by the target genes). The proteins highlighted in green correspond to the respective downregulated genes. Additionally to the genes indicated in the figure, fliZ, fliA, flgD, and flgJ were also found to be direct targets of BolA.
