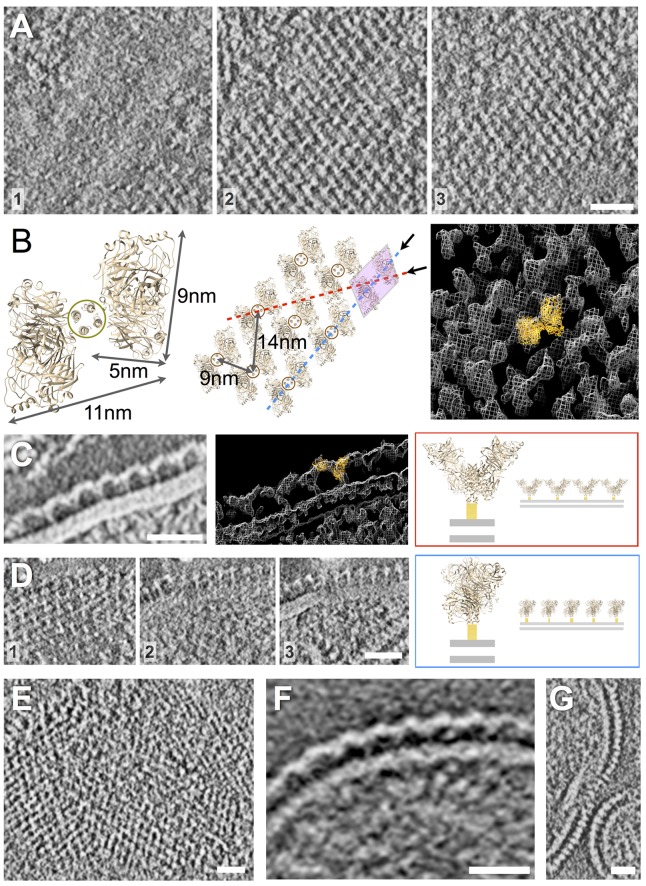
FIG 4 .
HN arrays imaged by negative-stain electron tomography (A to D) and cryo-electron tomography (E to G). (See Movies S1 to S4, S6, and S7 in the supplemental material.) (A) Serial 3.2-nm slices of a negative-stain tomographic reconstruction, increasing in elevation above the virus surface from left to right (numbered 1 to 3). Viewed from above (slices 2 and 3), this tetramer has a slanted “H” appearance positioned above punctate dots of density that correspond to the tetramer’s helical bundle stalk (slice 1). The ordered grids of density on the surface of the virions are composed of repeating units of density, in excellent agreement with the known structure for a tetramer of HN in the heads-down conformation; the crystal structure for NDV HN (3T1E.pdb) is shown for comparison. A model of the array organization based on the crystallographic structure for tetrameric, heads-down HN is shown in panel B and docked (orange ribbon diagram) into the EM density (white mesh). (C) Viewed laterally at the edge of a virus particle, the arrays are observed to flow into repeating rows of Y-shaped density features that correspond to the view of the HN array along the red line shown in panel B. 3T1E.pdb is shown docked into the EM density. (D) In other orientations, the arrays can be viewed down a different axis, indicated by the dashed blue line in panel B; serial slices are ordered from left to right (numbered 1 to 3). Scale bars, 25 nm. (E) Cryo-electron tomographic slice of virion surface shows similar arrays of density as seen from the top of a particle; note that the image gray scale has been inverted for comparison with negative-stain reconstructions above. (F) Y-shaped features are also observed at the edge of particles in central slices. (G) Additional views of the arrays from a different orientation also reveal the regular ordering of surface density. Scale bars, 25 nm.

