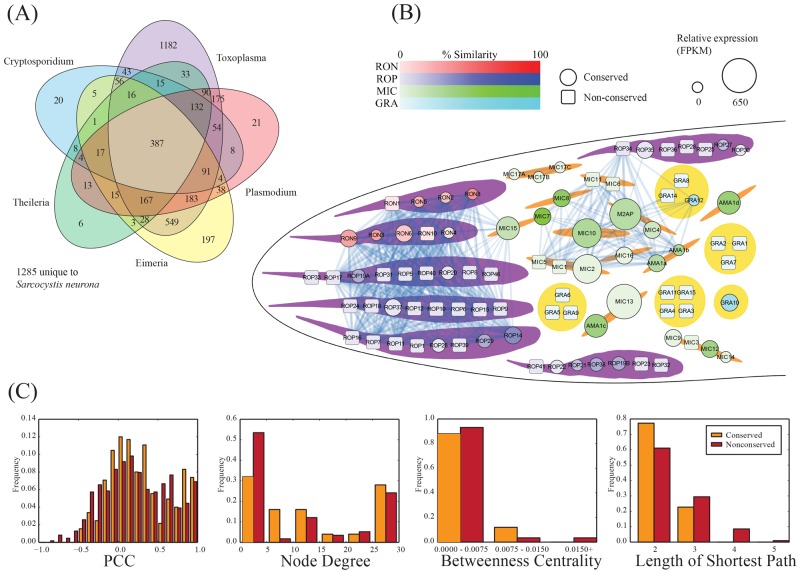
FIG 3 .
Coexpression network for T. gondii invasion-associated genes. (A) Ortholog distribution of S. neurona genes. Orthologs were predicted by using the InParanoid pipeline (51). (B) Network of T. gondii proteins involved in the invasion process. Nodes indicate genes, colored by family or location, with size indicating the relative expression of the S. neurona ortholog as determined through RNA-Seq expression. Square nodes indicate the absence of an ortholog in S. neurona. Links between nodes indicate significant coexpression (Pearson correlation coefficient [PCC], >0.8). Two main clusters of proteins are observed, one involving batteries of rhoptry proteins (ROPs and RONs) and one involving microneme proteins (MICs). (C) Network statistics associated with the invasion network.

