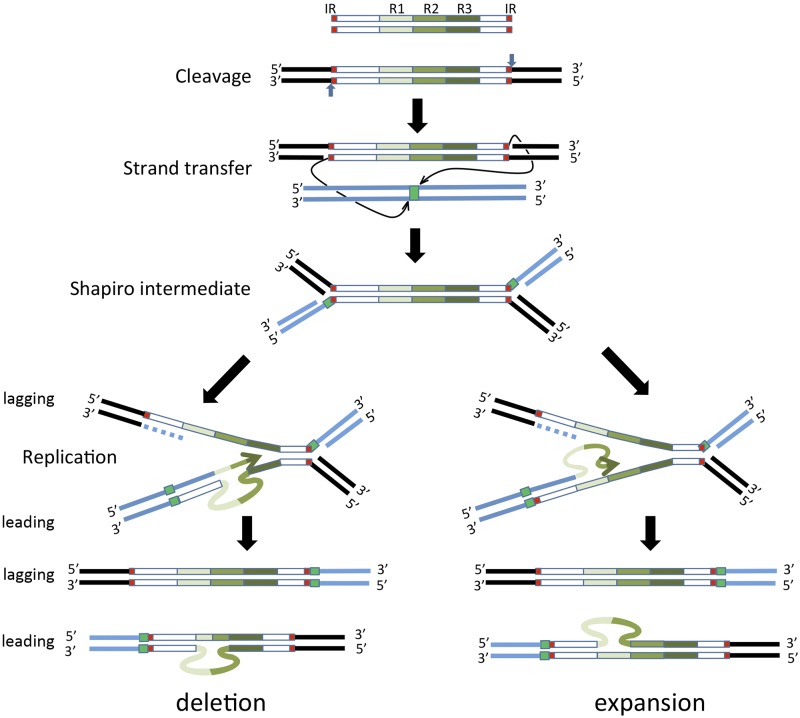
FIG 5 .
A model for generating variability in the number of TALE gene repeats. The proposed steps of Tn3 family replicative transposition are shown. Top to bottom: double-strand transposon showing the terminal inverted repeats (IRs, red boxes) and three repeat sequences (green scale boxes); the transposon in situ in the transposon donor molecule (flanking black bars), indicating the polarity of the two DNA strands and the polarity of cleavage (vertical blue arrows); transfer of the 3′ OH strand at each end of the transposon (thin arrows) at staggered positions (green square) into the target molecule (blue bars); formation of the branched Shapiro intermediate with both donor (black bars) and target (blue bars) DNA attached; replication of the intermediate structure showing leading strand synthesis (bottom branch of the fork) and lagging strand synthesis (top branch of the fork); replication fork slippage on the leading strand template (left) resulting in removal of repeat sequences or slippage on the nascent strand (right) resulting in expansion of repeat sequences, which are each resolved in a second round of replication.

