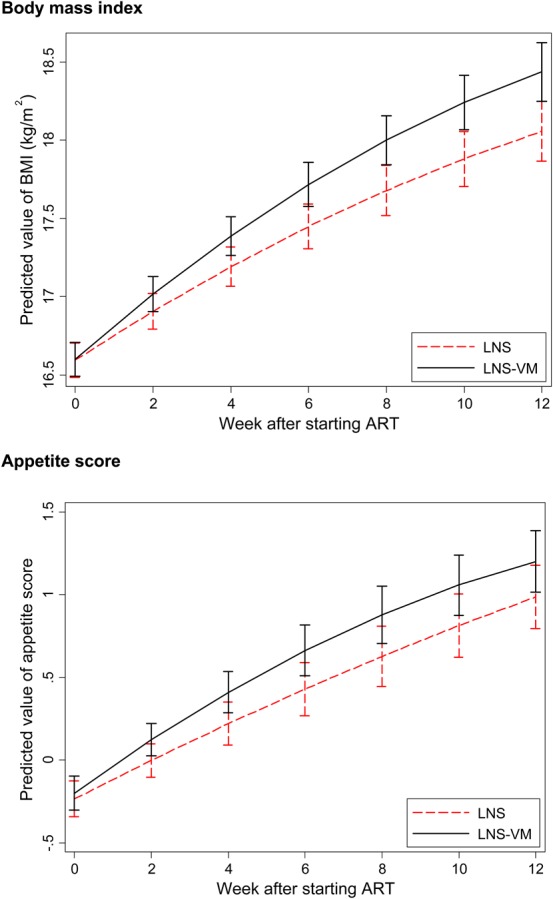
FIGURE 2.

Comparisons between treatment groups of BMI and appetite score after starting ART. Curves represent predictions based on all available data for all patients and are derived from quadratic equations with random slopes and intercepts, assuming the median pre-ART period of 21 days.
