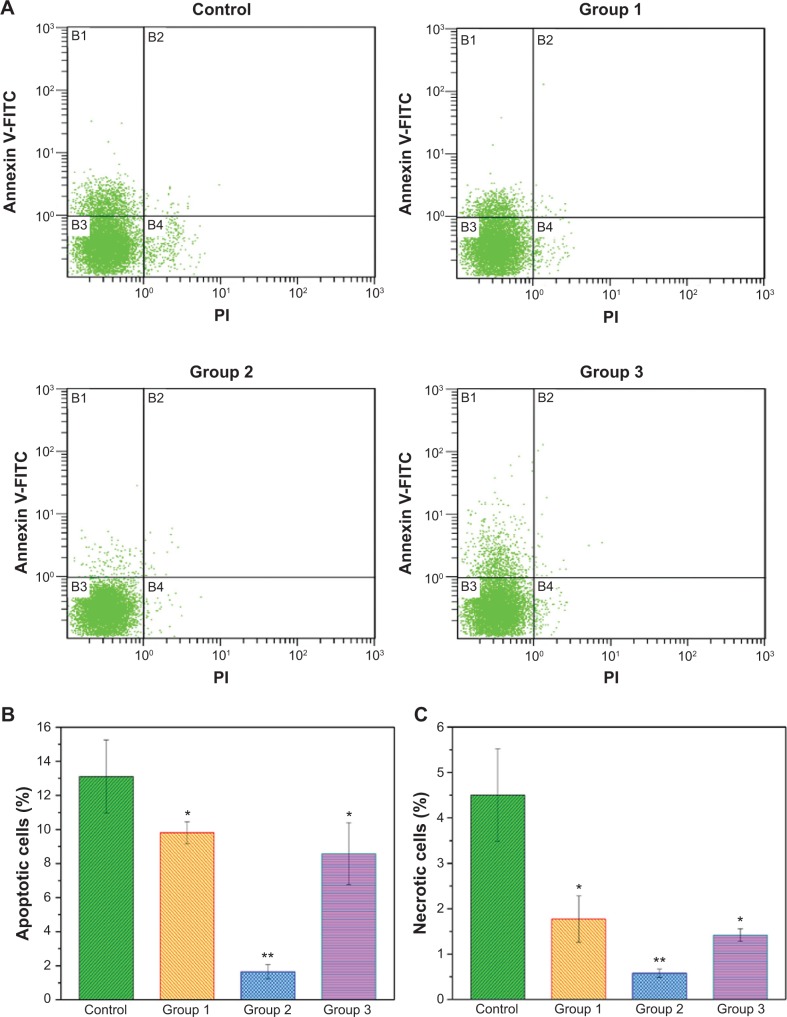
Figure 6.
Flow cytometric analyses of cell apoptosis after treatment with the different composites for 7 days.
Notes: (A) Typical figures for flow cytometric analysis of necrotic cells (X-axis, PI fluorescence) versus apoptotic cells (Y-axis, Annexin V-FITC) at 7 days. (B) The percentages of apoptotic cells for different groups. (C) The percentage of necrotic cells for different groups. *P<0.05 compared to the control group. **P<0.01 compared to the control group.
Abbreviations: FITC, fluorescein isothiocyanate; PI, propidium iodide.

