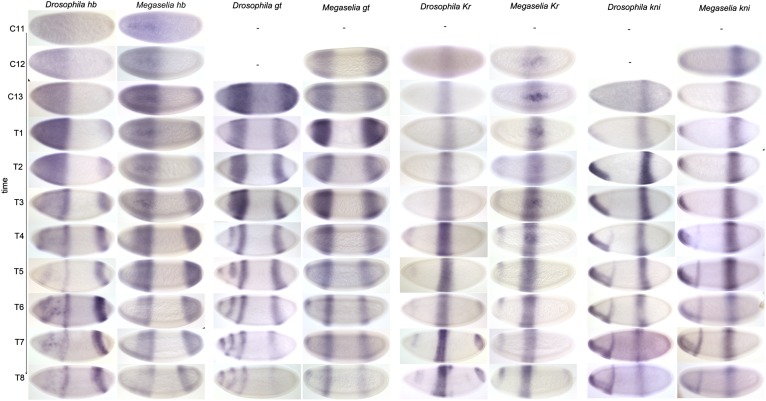
Figure 11. Expression data—trunk gap genes.
Time series of mRNA expression patterns of trunk gap genes hb, gt, Kr, and kni are shown for D. melanogaster (left) and M. abdita (right). Expression patterns are visualised by colorimetric (enzymatic) in situ hybridisation using wide-field microscopy as described in Crombach et al. (2012b). Early stages at the top, time progresses downwards. Embryo images show lateral views: anterior to the left, dorsal up. C11–13: cleavage cycles 11–13; T1–8: time classes subdividing C14A as defined in Surkova et al. (2008b) and Wotton et al. (2014). D. melanogaster patterns for C14A were published in Crombach et al. (2012a) and are shown for comparison.

