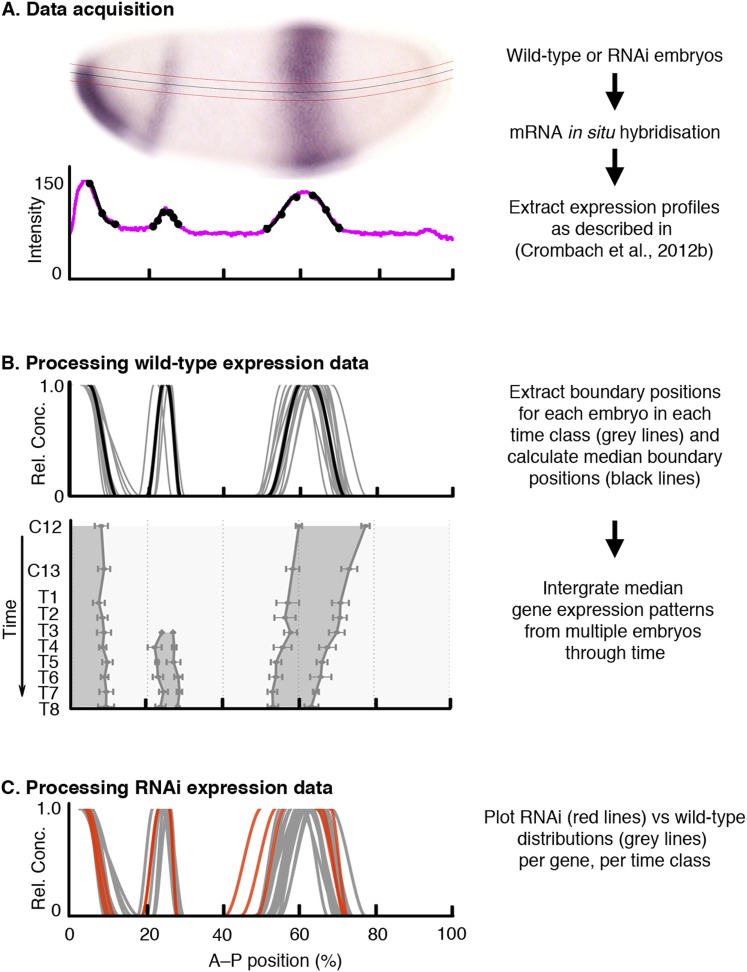
Figure 2. Data acquisition and processing of wild-type and RNAi knock-down embryos.
As an example, we show kni mRNA expression in wild-type and hb RNAi-treated embryos. (A) Data acquisition: wild-type or RNAi-treated embryos were stained by single or double in situ hybridisation using an enzymatic (colorimetric) protocol as described in Crombach et al. (2012a). Embryo image shows a lateral view (anterior to the left, dorsal up) stained for kni mRNA (purple). We extract boundary positions as described in Crombach et al. (2012b): first, we determine a 10% strip (delimited by red lines) along the midline of the dorso-ventral axis (black line). After the extraction of the intensity profile within this strip (magenta line in graph), we manually fit clamped splines to domain boundaries (black lines with mid- and end-points indicated by circles). (B) Extracted boundaries from wild-type embryos are classified by gene and time class (grey lines) and used to calculate median boundary positions (black line in upper panel). This yields an integrated spatio-temporal dataset of gene expression (lower panel). Shaded area represents regions of active expression delimited by positions of half-maximal expression for median boundaries (solid lines). Error bars represent 1.5x median absolute deviation (MAD), which approximates one standard deviation. (C) RNAi expression data (red) are plotted against wild-type boundary positions (grey). X-axes represent % A–P position (where 0% is the anterior pole). Y-axes represent pixel intensity or relative mRNA concentration in arbitrary units, except for the lower panel in (B), where the Y-axis represents time flowing downwards. C12/13: cleavage cycles 12/13; T1–8: time classes within C14A as defined in Wotton et al. (2014).

