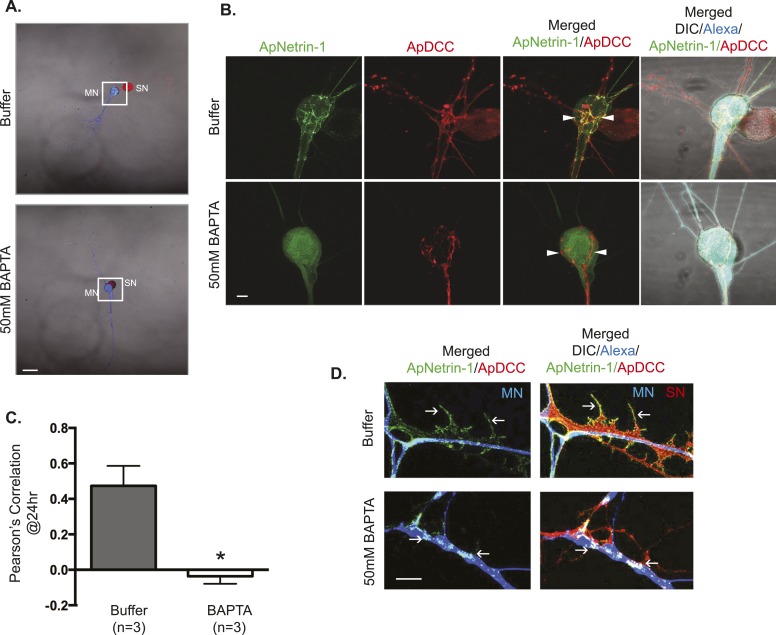
Figure 10. ApNetrin-1 undergoes calcium-dependent release from MN and binds SN.
SN-LFS MNs were cultured for 2 days, and the SN was microinjected with a vector expressing ApDCC c-terminally tagged with mCherry (red) and the MN with Alexa647 (blue) and with a vector expressing Aplysia netrin-1 (ApNetrin-1) c-terminally tagged with dendra2 (green). In the top panel of (A), the MN was microinjected with vehicle; in the bottom panel of (A), the MN was microinjected with BAPTA (50 mM) to chelate calcium. Cultures were imaged before and 24 hr after BAPTA or buffer injection later. The representative micrograph in (A) shows a low magnification image in which the DIC, ApDCC-mCherry (SN, red), and Alexa647 (MN, blue) signals are merged. (B) shows representative images taken 24 hr after microinjection of BAPTA or buffer of the areas highlighted by the white squares in (A). The green signal shows the ApNetrin-1 expressed in the MN; the red signal shows ApDCC expressed in the SN, the merged image is of the green ApNetrin-1 (expressed in MN) and red ApDCC (expressed in SN), and the far-right merged image is of DIC, Alexa647 (blue, MN), ApNetrin-1 (green, expressed in MN), and ApDCC (red, expressed in SN). In cultures in which the MN was microinjected with vehicle, the ApNetrin-1 (green) colocalizes with SN processes that are in contact with the MN soma (arrowheads) (top panel, B). In cultures in which calcium was chelated in the MN by microinjection of BAPTA, the ApNetrin-1 (green) signal is present within the MN soma, and do not colocalize with the ApDCC (red) in SN processes that are in contact with the MN (arrowheads). The amount of colocalization between the ApNetrin-1 signal and the SN (red) in the soma was quantified by Pearson's correlation (C). *p < 0.05, Student's unpaired t-test. Representative images of ApNetrin-1 (green, expressed in MN, blue) signal in distal processes of MNs microinjected with buffer or with BAPTA are shown in (D). In control (buffer-injected MNs) cultures, the green ApNetrin-1 signal decorates the red SN processes (arrows). In cultures in which calcium has been chelated by microinjection of BAPTA into the MN, the green ApNetrin-1 signal remains sequestered within the MN (blue). Scale bars in (A) =100 μm; in (B) = 20 μm; in (D) = 10 μm.


