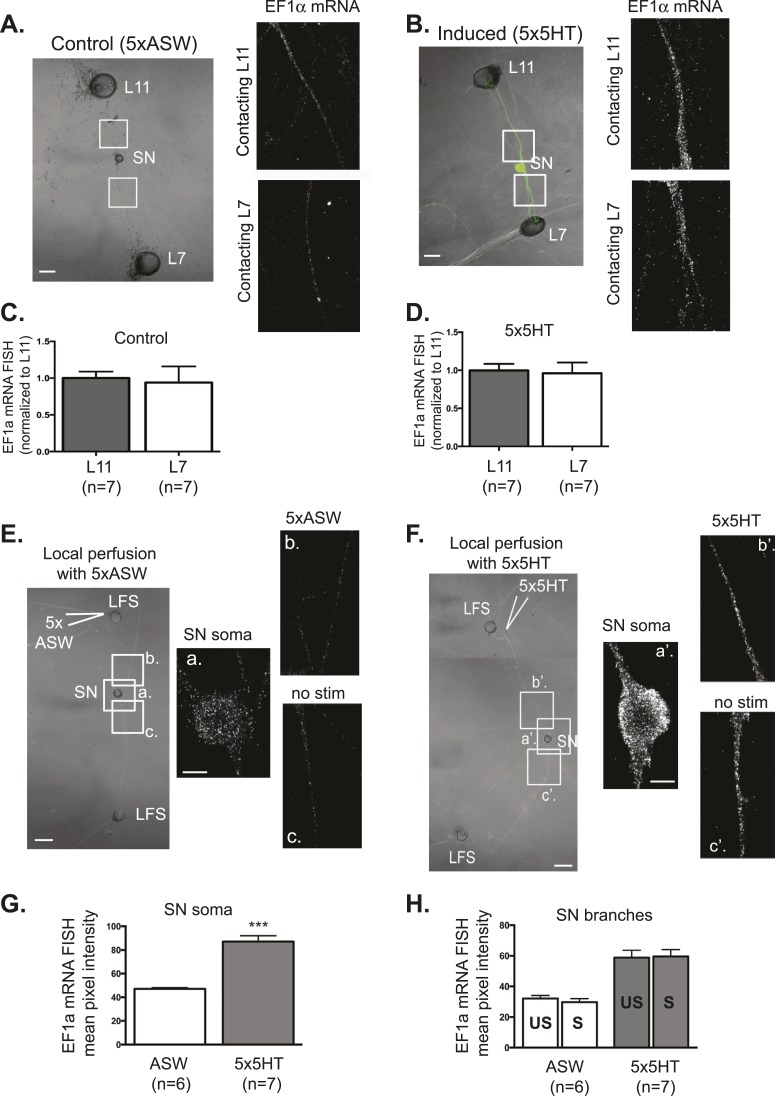
Figure 3. EF1α mRNA is induced by 5x5HT and is delivered throughout the neuronal arbor.
A bifurcated SN was cultured with an L7 target MN and an L11 non-target MN (A and B) for 3 days. Alexa647 (cyan) was microinjected into the SN before imaging to visualize SN processes. On day 3, cultures were stimulated with 5 bath applications of 5HT to induce long-term facilitation (LTF) (B), or mock stimulated with 5 bath applications of artificial seawater (ASW, the vehicle) as controls (A). Four hours later, cultures were processed for Fluorescent In Situ Hybridization (FISH) for EF1α mRNA. Areas in proximal SN neurites outlined with white squares in low magnification DIC image on the left were imaged at high magnification to visualize EF1α mRNA FISH signal. The increase in EF1α mRNA FISH signal in (B) as compared to (A) indicates that EF1α mRNA was induced by bath application of 5x5HT, as described in Giustetto et al (2003). Group data show that EF1α mRNA is evenly distributed between SN neurites contacting L7 target and L11 non-target MNs both in control cultures (C), and in cultures undergoing 5HT-induced LTF (D). A bifurcated SN was cultured with two LFS motor neurons (E and F) for 3 days. On day 3, local perfusion of five pulses of 5HT was performed to induce branch-specific LTF (F), as described in Martin et al (1997); in control cultures, synapses were mock stimulated with five pulses of ASW (E). Four hours later, cultures were processed for Fluorescent In Situ Hybridization (FISH) for EF1α mRNA. Areas in soma and proximal SN neurites outlined with lettered white squares in low magnification DIC image on the left were imaged at high magnification to visualize EF1α mRNA FISH signal. The increase in EF1α mRNA FISH signal in (F) as compared to (E) indicates that EF1α mRNA was induced by local stimulation with 5x5HT. This increase is quantified in SN soma and in proximal neurites in (G) and (H). As shown in (H), basally expressed and local stimulation-induced EF1α mRNA was evenly distributed between 5HT-stimulated (S)- and unstimulated (US)-SN branches. ***p < 0.001, Student's unpaired t-test. Differences in FISH signal between mock (ASW)-stimulated and -unstimulated branches (E) and 5HT-stimulated and -unstimulated branches (F) were not significant, Student's paired t-test (H). Scale bar in (A, B, E and F) =100 μm; in (E(a) and F(a′)) =20 μm.

