. 2015 Feb 3;4:e04000. doi: 10.7554/eLife.04000

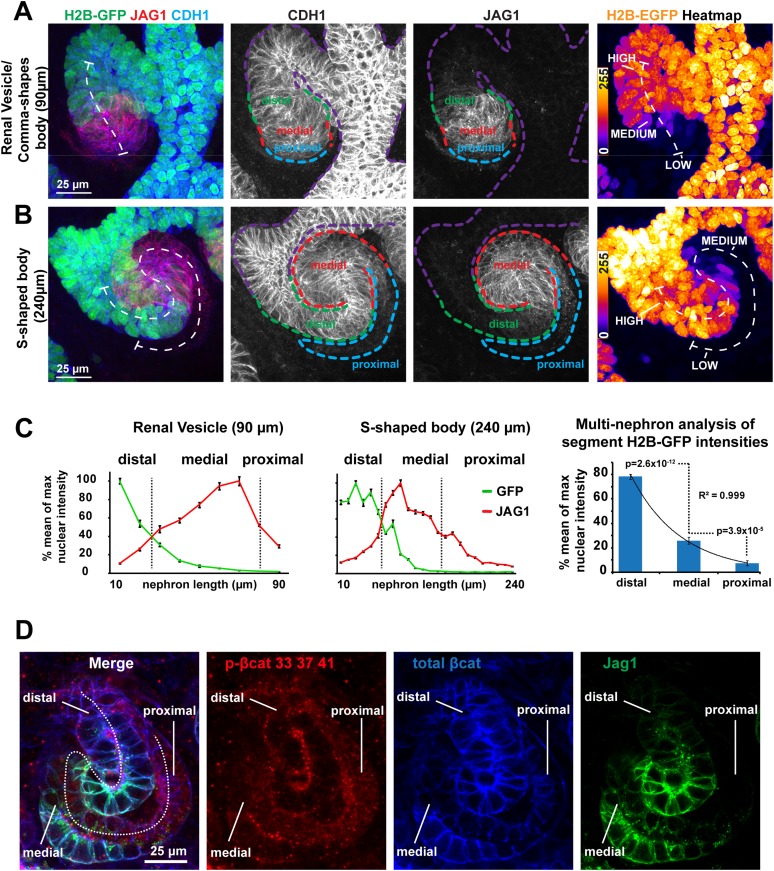
Figure 1. β-catenin activity levels form a reversed gradient along the axis of the nephron.

(AB) TCF/Lef::H2B-GFP expression in nephrons: (A) late renal vesicle/early comma-shaped body nephron, (B) S-shaped body nephron, lines: white–nephron axis, purple–ureteric bud, green–distal nephron, red–medial nephron, blue–proximal nephron/glomerular precursors. Heat-maps display signal intensity in different nephron segments. (C) Quantification of nuclear H2B-GFP and cell-membrane Jag1 antibody stain signal-intensity along the proximal–distal axis. Error bars represent SEM of pixels representative of 10 µm segments. Right-hand side graph shows mean values for segments, as identified by H2B-GFP and Jag1 profiles (n = 11 nephrons), error bars indicate SEM. p-values derived from t-tests. (D) Antibody stains against total β-catenin and phosphorylated β-catenin in S-shaped body nephron—Jag1 marking the medial segment. White dashed line indicating nephron axis.

DOI: http://dx.doi.org/10.7554/eLife.04000.003

Figure 1.

Figure 1—figure supplement 1. β-catenin reporter and antibody data show different β-catenin activity levels along the axis of the nephron.

Figure 1—figure supplement 1.

(A) TCF/Lef:H2B-GFP time-lapse data of a nephron developing through post-MET Pretubular Aggregate (PTA), Renal Vesicle (RV), Comma-shaped (CB), and S-shaped (SB) stages. These data are shown as time-lapse in Video 2. (B) S-shaped body nephron from Figure 1B shown at four different brightness settings that represent a doubling in brightness for each field going left to right. This clearly shows that all segments of the nephron are positive for the TCF/Lef:H2B-GFP reporter but follow a visual gradient. Green arrows point to positive cells in the dimmest portion of the nephron and an area of the kidney that even in at the brightest settings show up as negative. (C) Quantification of antibody stain for β-catenin phosphorylated at Ser33/Ser33/Thr41 in the distal, medial, and proximal segments (nine measurements per nephron in five nephrons). Error bars represent SEM, p-values derived from t-tests. (DF) Lef1 and Ccnd1 (CycD1) antibody stains in S-shaped body nephrons; Pax2 is used as a structural marker against all nuclei within the nephron, Jag1 is used to detect the medial segment, Wt1 is used to detect the developing podocytes in the proximal segment.