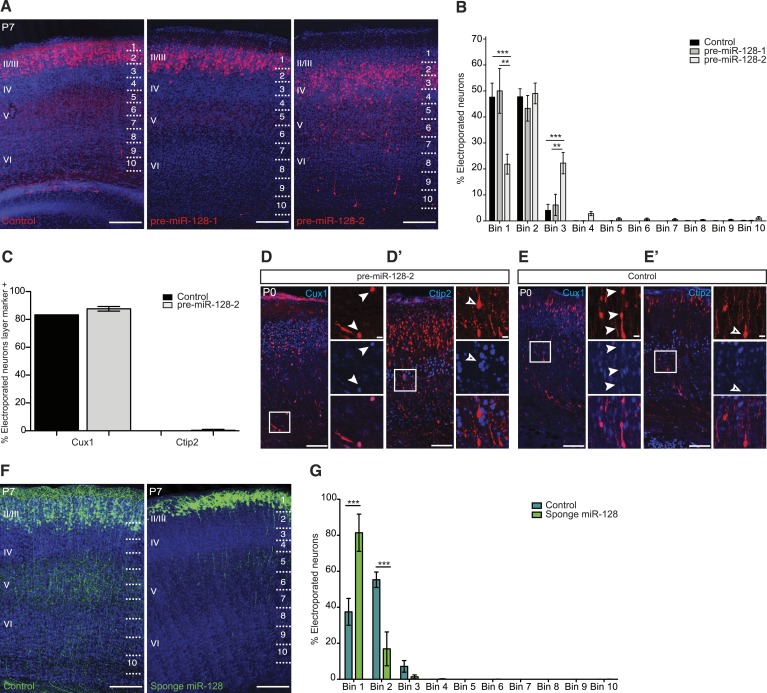
Figure 3. miR-128 misexpression impairs neuronal migration.
(A) Representative brain sections of P7 mice showing intron-RED control (left), pre-miR-128-1-RED (middle), pre-mir-128-2-RED (right) after in utero electroporation at E15.5. Sections were processed for staining with DRAQ5 to reveal nuclei and anti-RFP antibody to reveal electroporated cells. On the right side of each picture the position of the bins used to assess migration is shown (see ‘Materials and methods’). Scale bars represent 50 µm. (B) Percent of total counted neurons present in each bin is plotted. Data are from 3 to 4 mice per condition. Two-way ANOVA with Bonferroni post-test, error bars represent Standard deviation. *p < 0.05 **p < 0.01, ***p < 0.001. Electroporation of pre-miR-128-2 (white bars) but not pre-miR-128-1 (gray bars) caused a shift from uppermost layers (Bin 1) to lower layers (Bin 3) compared to control (black bars). (C) Quantification of P0 electroporated neurons expressing the upper layer marker Cux1 or the layer V marker Ctip2. Electroporation of pre-miR-128-2-RED (gray bars) does not change the cell fate compared to control (black bars). (D–E′) Representative brain sections of P0 mice, analyzed in (C), stained for dsRed to show pre-miR-128-2-RED electroporated cells (red, D and D′) and Intron-RED (red, E and E′). In (D) and (E) sections were co-stained for the layer II-IV marker Cux1 in blue. In (D′) and (E′) sections were co-stained for the layer V marker Ctip2 in blue. Neighboring images show higher magnification views of boxed regions of interest. In (D) and (E) from top to bottom: pre-miR-128-2 (red, D) or control (red, E), Cux1 (blue) and merged view. In (D′) and (E′) from top to bottom: pre-miR-128-2 (red, D′) or control (E′), Ctip2 (blue) and merged view. Scale bars 20 μm or 5 μm. Arrowheads in (D and E) mark dsRED+/Cux1+ migrating cells. Empty arrowhead in (D′ and E′) marks a dsRED+/Ctip2- cell situated in layer V. (F) Representative brain sections of P7 mice showing the control eGFP construct (left) and the miR-128 sponge (right) after in utero electroporation at E15.5. Sections were processed for staining with DRAQ5 to reveal nuclei and anti-GFP antibody to reveal electroporated cells. On the right side of each picture the position of the bins used to assess migration is shown (see ‘Materials and methods’). Scale bar represents 50 µm. (G) Percent of total counted neurons present in each bin is plotted. Data are from 3 to 5 mice per condition. Two-way ANOVA with Bonferroni post-test, error bars represent Standard deviation ***p < 0.001. Electroporation of the miR-128 sponge caused a shift from Bins 2–3 to Bin 1 (light green bars) compared to control (dark green bars).


