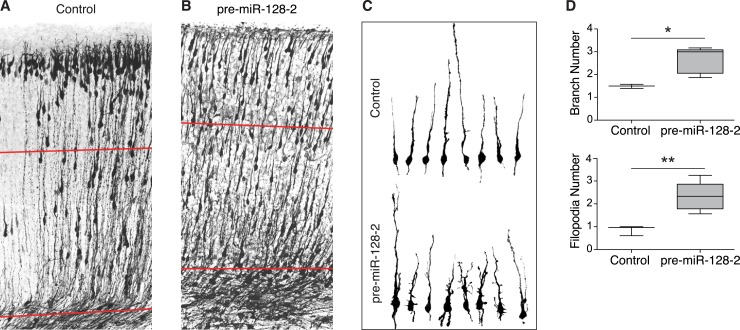
Figure 4. Neurons misexpressing miR-128 show impaired radial morphology.
(A and B) P0 sections from littermates electroporated at E15.5 with control Intron-RED (A) or pre-miR-128-2-RED (B) expression constructs. Sections were stained for dsRed to reveal electroporated cells, rendered in black and white. Red lines indicate the boundaries of the deep layers of the cortical plate, as determined by nuclear staining (not depicted). (C) Reconstructed migrating neurons sampled from the deep layers (red lines in A and B). Upper row shows Intron-RED control neurons, bottom row shows pre-miR-128-2-RED electroporated neurons. (D) Box plot of total branch (upper graph) and filopodia (lower graph) number per reconstructed neuron. (58 neurons from 3 Intron-RED brains and 67 neurons from 5 pre-miR-128-2-RED brains were analyzed, significance determined with an unpaired Student’s t test *p < 0.05, **p < 0.01).

