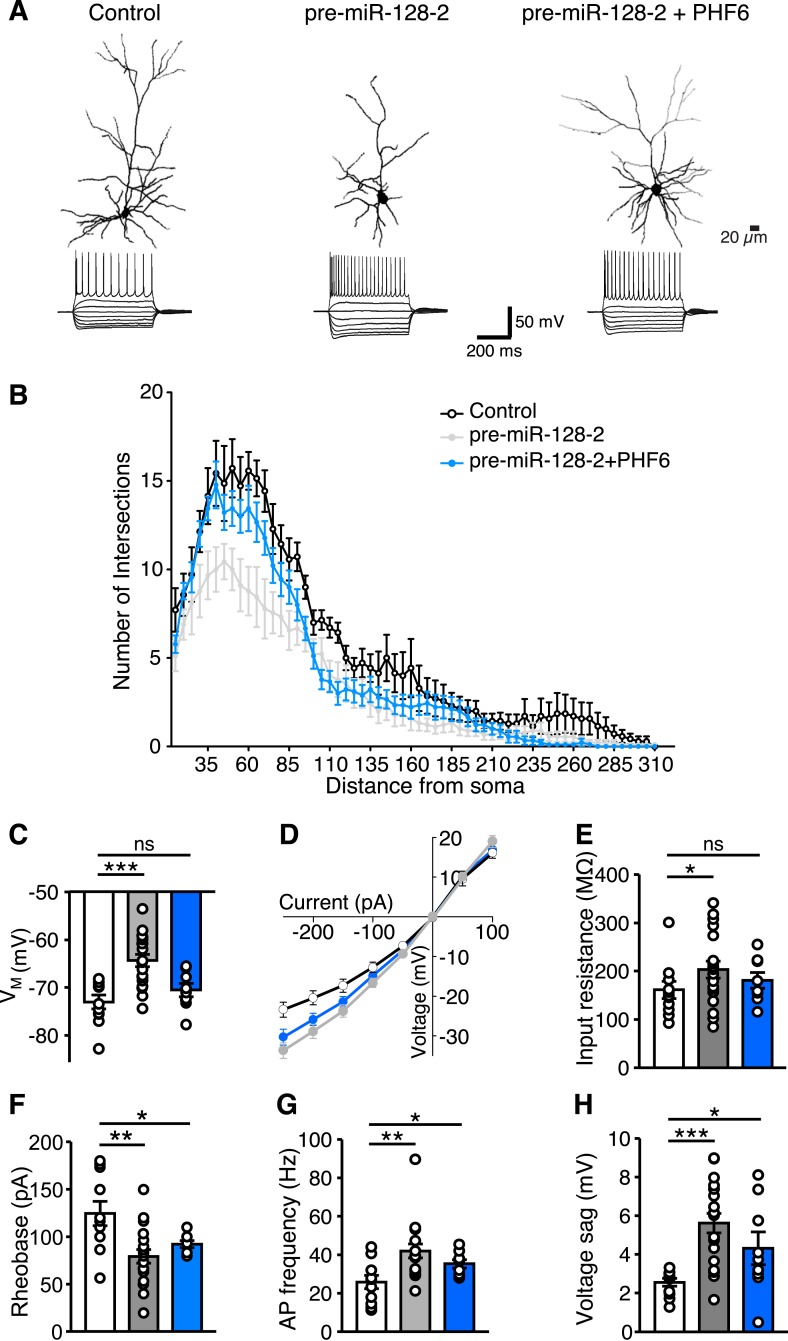
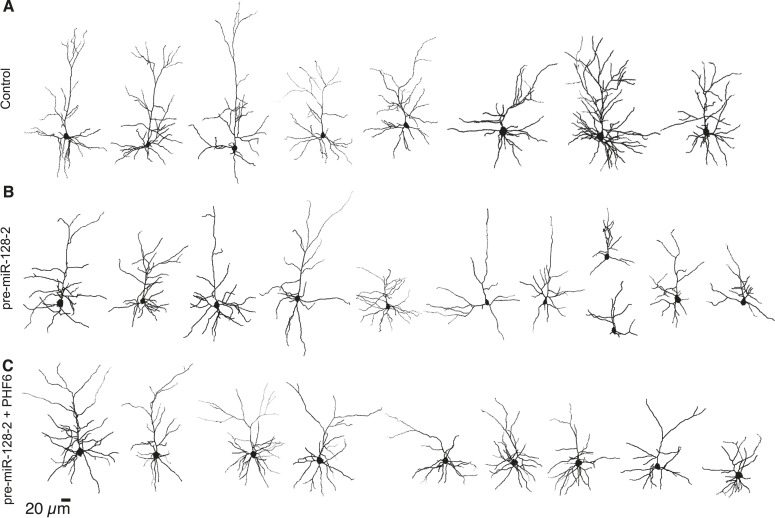
Figure 7. miR-128 and PHF6 regulate dendritic complexity and intrinsic excitability.
(A) Cells from electroporations using Intron-RED (left), pre-miR-128-2-RED (middle), or pre-miR-128-2-RED plus PHF6-GFP (right) were recorded and filled. Representative reconstructed neurons (top) and their voltage responses to a family of current pulses (bottom) are shown. Compared to Intron-RED control, AP discharge is increased by pre-miR-128-2-RED and intermediate upon co-expression of pre-miR-128-2-RED and PHF6-GFP. (B) Sholl analysis of filled and reconstructed neurons, from Intron-RED (open circles, n = 7 cells), pre-miR-128-2-RED (gray, n = 9 cells), and pre-miR-128-2-RED plus PHF6-GFP (blue, n = 9 cells) electroporated neurons. Error bars represent standard error of the mean. (C, E–H) Summary bar charts of intrinsic physiological properties: Membrane potential (VM C), Input resistance (RI E), Rheobase (F), Action Potential (AP) frequency (G) and voltage sag (H). Colors as in (B), bars are overlain by data from individual cells. (D) Current–voltage relationship for the three groups of electroporated neurons, color scheme as in (B). Note the steep curve for pre-miR-128-2-RED neurons, and partially recovered RI relationship for PHF6 rescue neurons. Statistics: ns – p > 0.05, *p < 0.05, **p < 0.01, ***p < 0.001, Two-way ANOVA for graph in (B) and Mann–Whitney non-parametric test for graphs in C, E–H.


