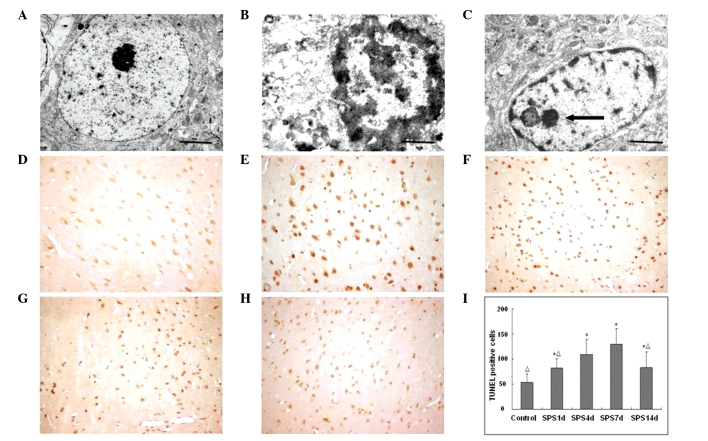
Figure 1.
(A–C) Transmission electron microscopy revealed morphological changes in the neurons of the mPFC. (A) Control; (B) SPS 7 day; and (C) SPS 14 day groups; (scale bar, 1 μm). (D–I) Apoptotic cells in the mPFC by TUNEL staining. (D) Control; (E) SPS 1 day; (F) SPS 4 day; (G) SPS 7 day; and (H) SPS 14 day groups (magnification, ×400). (I) Quantification of apoptotic cells. Data are expressed as the mean ± standard deviation. *P<0.05 compared with the control group, #P<0.05 compared with the SPS 7 day group. mPFC, medial prefrontal cortex; SPS, single-prolonged stress; TUNEL, terminal deoxynucleotidyl transferase-mediated dUTP nick end labeling.

