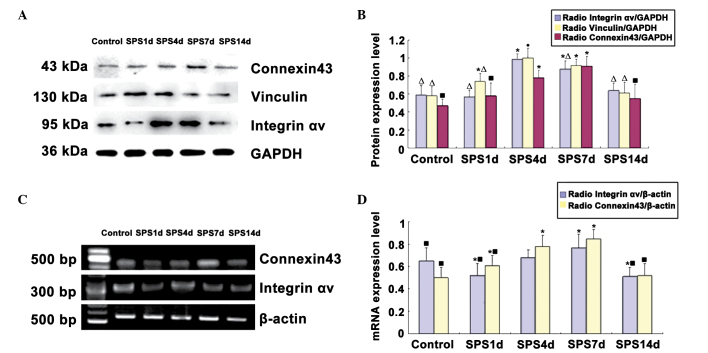
Figure 4.
Western blot analysis and RT-PCR analysis for integrin αv, vinculin and connexin43 in the medial prefrontal cortex. (A) Western blot analysis. (B) Quantification of the western blot analysis. (C) RT-PCR analysis. (D) Quantification of RT-PCR analysis. Data are presented as the mean ± standard deviation. *P<0.05 compared with the control group, ΔP<0.05 compared with the SPS 4 day group, =P<0.05 compared with the SPS 7 day group. RT-PCR, reverse transcription polymerase chain reaction; SPS, single-prolonged stress.

