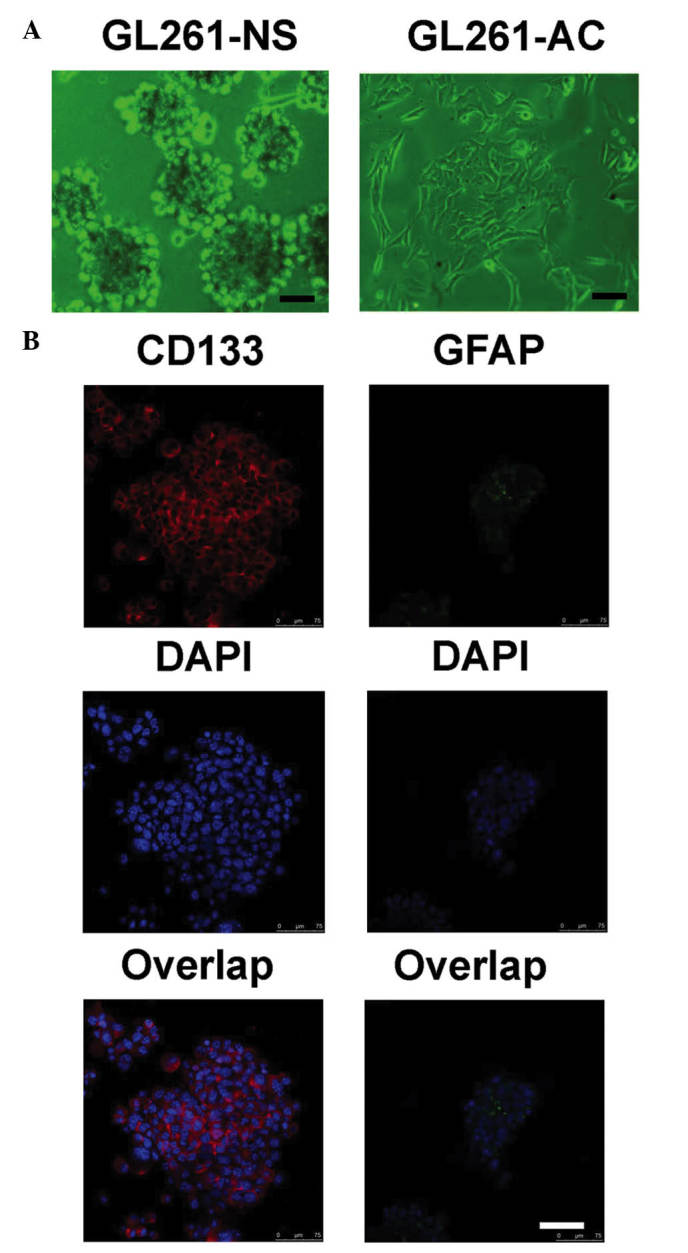
Figure 1.

GL261-NS and GL261-AC cells cultured in vitro. (A) Cells were visualized under phase contrast microscopy. Scale bar=50 μm. (B) Immunofluorescence of stem cell maker CD133 (red) and differentiated glia cell marker, GFAP (green). Cell nuclei were counterstained with DAPI (blue). Scale bar=75 μm. GFAP, glial fibrillary acidic protein; NS, neurospheres; AC, adherent cells; DAPI, 4′,6-diamidino-2-phenylindole.
