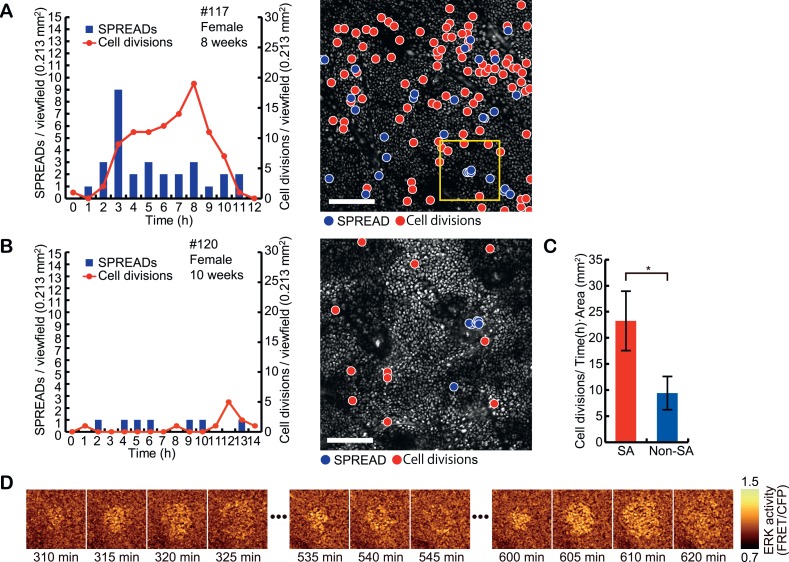
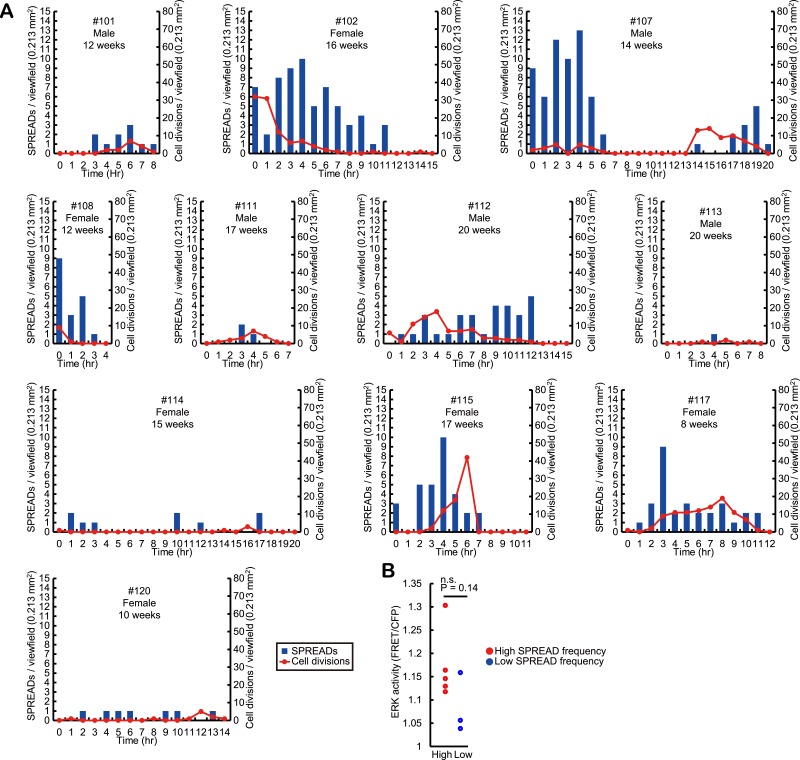
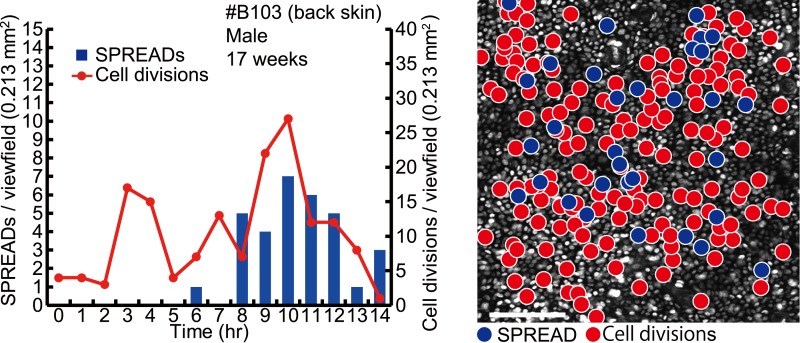
Figure 4. Spatio-temporal association of SPREADs with cell divisions.
(A and B) Left panels show frequencies of SPREADs (blue) and cell divisions (red) during periods with frequent SPREADs (A) and less frequent SPREADs (B). Right panels show mapping of the centres of SPREADs (blue circle) and cell divisions (red circle) observed during each imaging period. Shown are single frames of CFP images of a 0.213 mm2 viewfield. Individual mouse identification numbers, sex and age are shown on the top of the left panels. Scale bar, 100 μm. (C) The frequency of cell division in and out of the SPREAD area. SPREAD area was defined as the area within 100 μm from the origin and within 1 hr of the onset of the SPREAD. *p < 0.05 (paired Student's t test). (D) Time-lapse images of the yellow square region in (A), showing three SPREADs emerging from the same spot.


