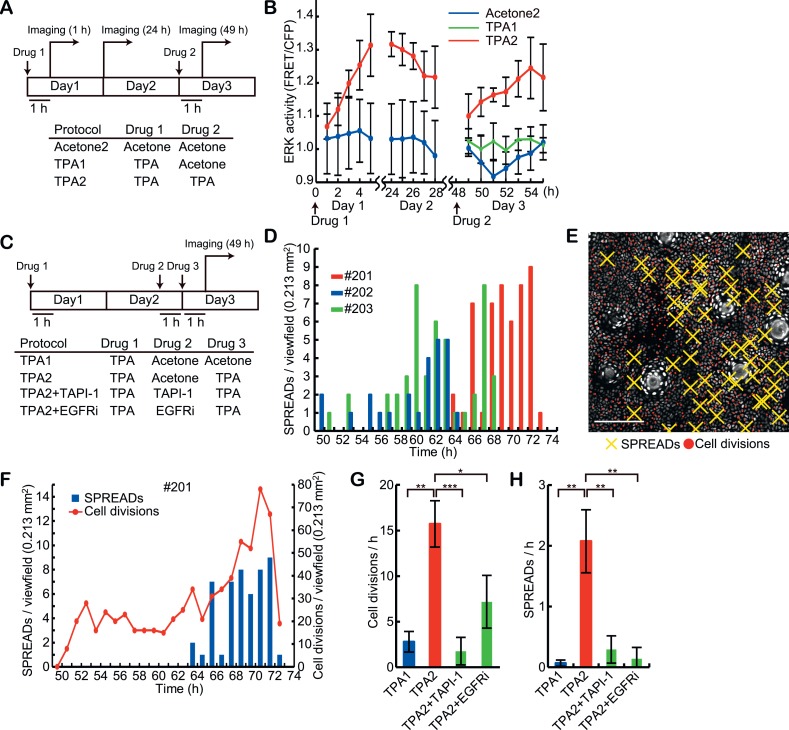
Figure 5. Induction of SPREADs by the double TPA treatments.
(A) Eisuke mice were subjected to topical application of 20 μl acetone with or without 0.5 nanomole TPA and imaged according to the protocols. Images were acquired every 1 hr during 5- to –7-hr imaging periods. Mice were returned to the cage after the imaging and the same area of the skin was revisited on the next day. (B) ERK activity in the basal epidermal cells was monitored in FVBEKAREV−NES mice. Average FRET/CFP ratio and S.E.M. of three mice are shown for each. Error bars indicate S.E.M. of the three mice. (C) Protocols for the double TPA application in the presence of inhibitors. Drugs were used as follows: 0.5 nanomole TPA, 207 nanomole PD0329105, 2.0 nanomole TAPI-1, and 0.2 nanomole PD153035 in 20 μl acetone, or vehicle alone. (D) A histogram of SPREADs of the three mice, #201, #202, and #203, which were treated twice with TPA2 in (C). (E) A map of SPREADs (yellow cross) and cell divisions (red dot) observed during 48–72 hr in the mouse #201. (F) The numbers of SPREADs and cell divisions observed in each period. Data are from mouse #201. (G and H) Numbers of cell divisions (G) and SPREADs (H) observed in a 0.213 mm2 viewfield per hour during the observation. Average and S.E.M. are shown. At least three mice were analysed for each protocol. *p < 0.05; **p < 0.01; ***p < 0.001 (paired Student's t test).

