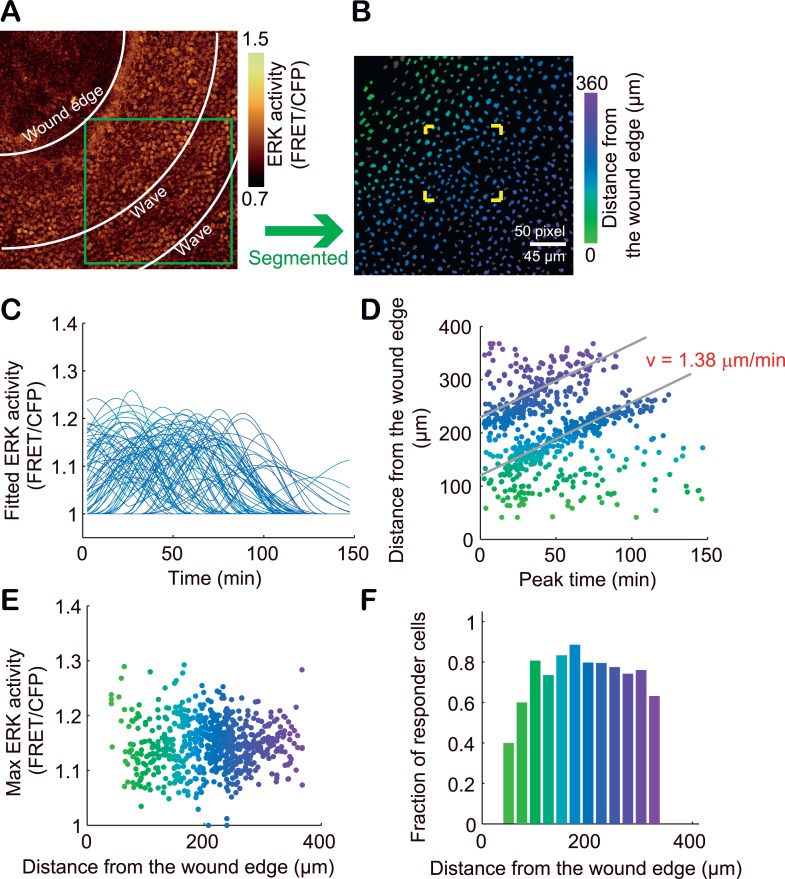
Figure 8. Single cell analysis of ERK propagation waves from the wound edge.
(A) A gold pseudo-colour image of FRET/CFP ratio in an Eisuke mouse wounded 12 hr before observation. The image is cropped from Video 5. (B) The green-square region in (A) is magnified. The colours of segmented nuclei indicate the distance from the wound edge. Grey nuclei indicate non-responder cells. (C) With each nucleus, the time course of FRET/CFP values was approximated with a flat line or one to three sine curves as performed in Figure 3. (D) The distance from the wound edge to each cell was plotted against the peak ERK activation time to determine the velocity of ERK activation propagation. (E) The Max ERK activity of each cell was plotted against the distance from the wound edge. (F) The fraction of responder cells in each distance.

