. 2015 Jan 16;4:e04970. doi: 10.7554/eLife.04970

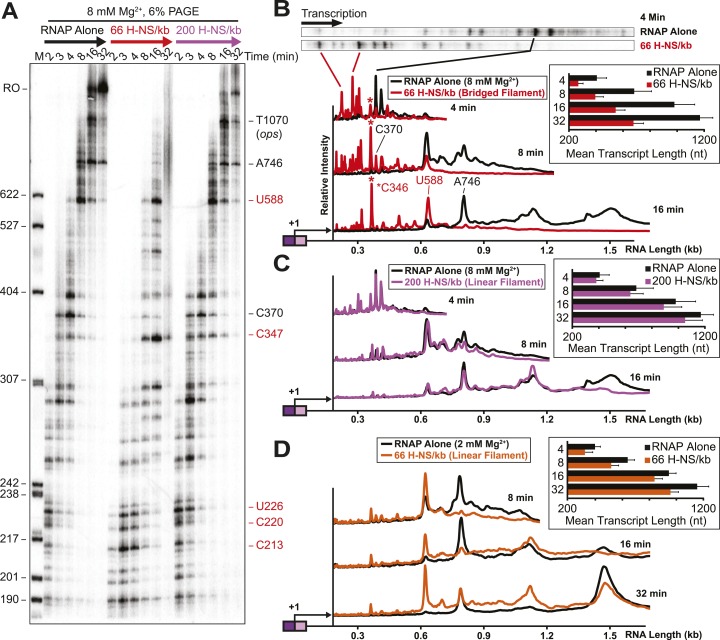
Figure 2. H-NS dramatically decreased transcript elongation in vitro.

(A) In vitro transcription in the presence of 66 H-NS/kb or 200 H-NS/kb filaments at 20°C, 8 mM Mg2+, and 30 µM each NTP. ECs (10 nM) were formed at the end of the C-less cassette on the λPR-bgl template (A26 ECs) and then incubated with H-NS. Samples were removed at 2, 3, 4, 8, 16, and 32 min after addition of NTPs and separated by 6% PAGE. M, 5′ end-labeled, MspI-digested pBR322 marker. RO, run-off RNA. Pauses mapped to single-nt resolution in Figure 2—figure supplement 1 and Table 1 are indicated on the right side of the gel in red for H-NS-stimulated pauses and black for H-NS independent pauses. (B, C) Densitometry profiles of transcripts produced at 8 mM Mg2+ and 20°C from the λPR-bgl template in 66 H-NS/kb or 200 H-NS/kb filaments (B and C, respectively) or without H-NS (see ‘Materials and methods’). In (B), the 4-min time point from the gel shown in (A) is displayed horizontally to allow alignment with the densitometry profile (larger transcripts are to the right). Key pauses are marked in the profiles. Insets, mean transcript lengths and standard deviations were calculated from at least four independent experiments. (D) Densitometry profiles of transcripts produced at 2 mM Mg2+ and 20°C from the λPR-bgl template in 66 H-NS monomer/kb compared to without H-NS. Inset, mean transcript lengths and standard deviations were calculated from at least four independent experiments.

DOI: http://dx.doi.org/10.7554/eLife.04970.007

Figure 2.

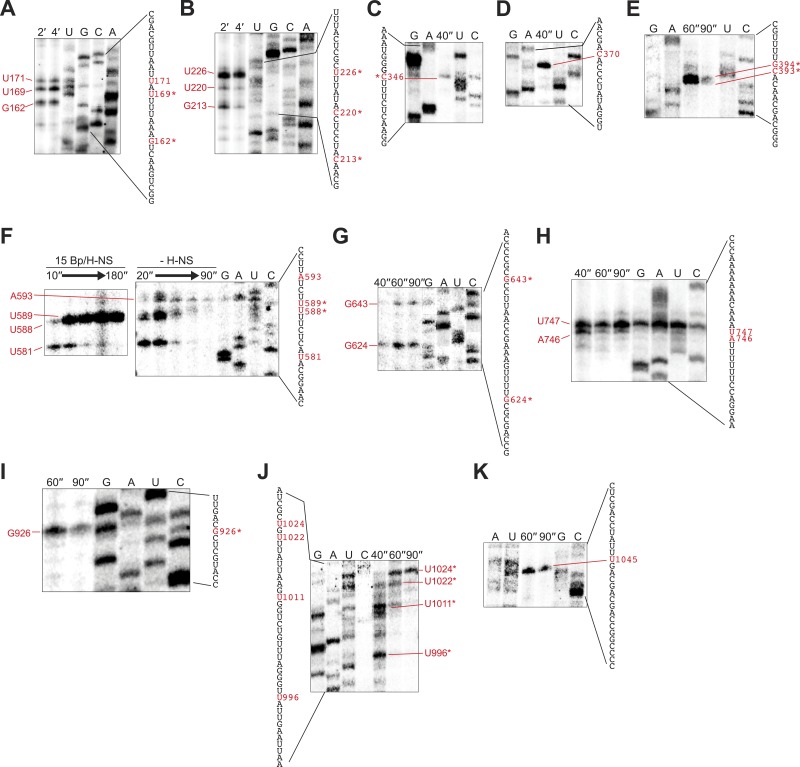
Figure 2—figure supplement 1. Mapping of 3′ ends of pauses on λPR-bgl template.

Figure 2—figure supplement 1.

(AK) Pauses on the λPR-bgl template were could be mapped to nucleotide resolution up to ∼200 nucleotides downstream from the transcription start site using ladders generated by 3′-deoxy NTP incorporation (see ‘Materials and methods’). To map pauses further downstream, we prepared truncated templates that deleted 5′ portions of the bgl transcribed region (pMK122, pMK110-520, pMK124, and pMK126; ‘Materials and methods’). Halted A26 ECs (10 nM) were formed on pMK110 template (AB), pMK122 template (CE), pMK110-520 template (FG), pMK124 template (H), or pMK126 template (IK). Transcription was then restarted with 30 μM ATP, UTP, GTP, and CTP at 37°C with or without 10–50 μM 3′-deoxy GTP, ATP, UTP, or CTP (concentrations were adjusted depending on the segment to be examined). Samples were collected at times indicated on the panels and then separated by 8% PAGE. Lanes are marked with sample times or the 3′-deoxyNTP used. Contrast in each image was adjusted to increase visibility. The mapped sequence is indicated next to each panel with the pause 3′ nucleotide highlighted in red. H-NS-stimulated pause sequences are starred. In one case (G), transcription was restarted in the presence or absence of 66 H-NS/kb at 20°C to determine which pause was H-NS dependent.
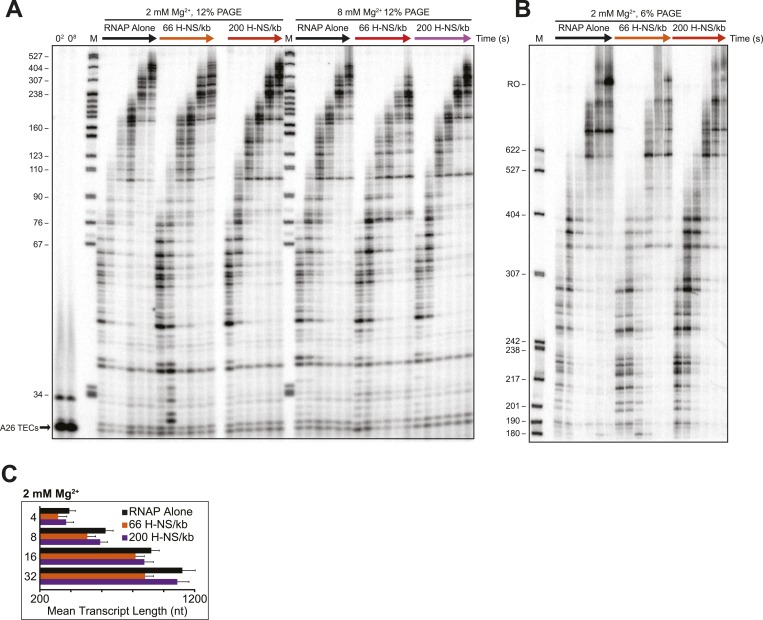
Figure 2—figure supplement 2. Linear H-NS filaments had minimal effects on elongation.

Figure 2—figure supplement 2.

(A) 10 nM halted ECs formed on the λPR-bgl template were incubated with H-NS in either 2 or 8 mM Mg2+ to reach equilibrium. 30 μM NTPs were added, time points were taken at 10, 20, 40, 60, 120, and 180 s at 20°C, then resolved by 12% PAGE. M denotes labeled MspI-digested pBR322 marker. 02 and 08 refers to the time point taken prior to the addition of NTPs in 2 or 8 mM Mg2+ respectively. (B) PAGE (6% PA) of the 2 mM Mg2+ reactions described in (A). Time points were taken at 2, 3, 4, 8, 16, and 32 min at 20°C. M denotes labeled MspI-digested pBR322 marker, and RO indicates template run-off products. (C) Mean transcript lengths at various time points plotted with error bars depicting standard deviations of at least four independent experiments assembled in 2 mM Mg2+ buffer.
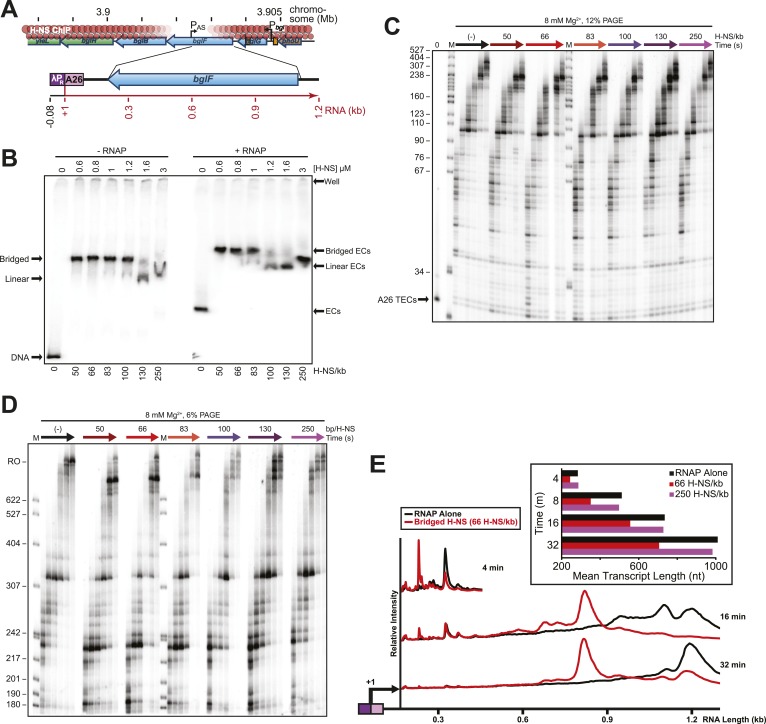
Figure 2—figure supplement 3. H-NS effects on transcript elongation also occurred on a different template.

Figure 2—figure supplement 3.

(A) The 1.27-kb linear pMK121 DNA template (λPR-bglF template) similarly contains the λPR promoter followed by a 26-nucleotide C-less cassette and includes a different portion of the bgl operon, the region downstream of the bglF antisense promoter (PAS) (Peters et al., 2012). (B) Native PAGE of filaments formed on 10 nM labeled λPR-bglF template at increasing H-NS concentrations and 8 mM Mg2+ (−RNAP lanes). (+RNAP lanes), 10 nM halted A26 ECs at increasing H-NS concentrations and 8 mM Mg2+. (C) A26 ECs (10 nM; λPR-bglF template) were incubated with H-NS in 8 mM Mg2+. NTPs (30 µM) were added, samples were removed at 10, 20, 40, 60,120, and 180 s and 20°C, and the samples were resolved by denaturing PAGE (12% PA). M, labeled MspI-digested pBR322 marker. 0, time point taken prior to the addition of NTPs. (D) PAGE in 6% PA of the reactions described in (C). Samples were taken at 2, 3, 4, 8, 16, and 32 min, M, labeled MspI-digested pBR322 marker, RO, indicates template run-off products. (E) Densitometry profiles of various time points of reactions with 66 H-NS/kb compared to the absence of H-NS. Mean transcript lengths at various time points from two independent experiments are shown in the chart.