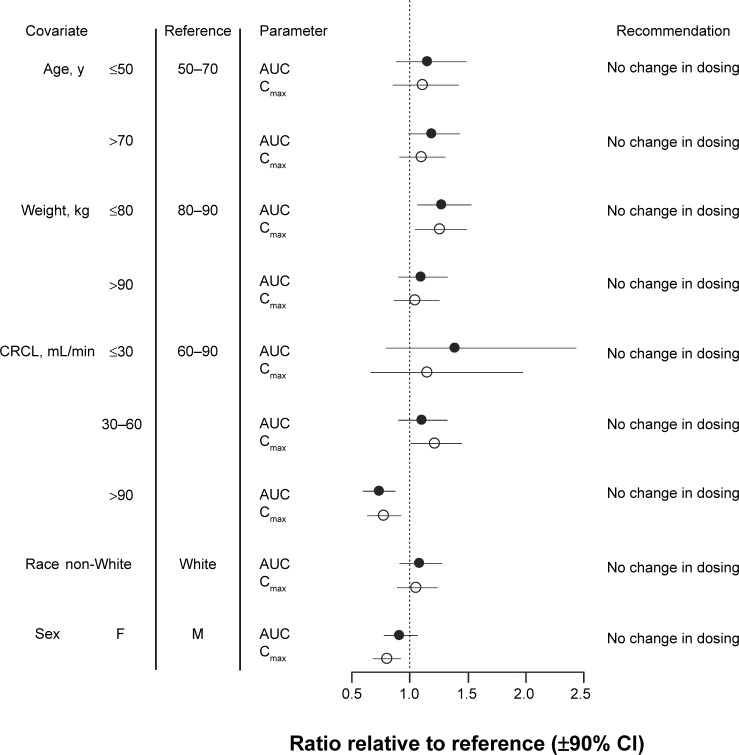
Figure 5.
Forest plot summarizing the influence of diabetic macular edema on the systemic exposure to pegaptanib.
Notes: The mean ± 90% CI of ratios of the area under the concentration–time curve (AUC; black circle) and maximum concentration (Cmax; white circle) for the various covariates relative to the reference values for these pharmacokinetic parameters are shown. As an example, if the AUC for a patient with a body weight ≤60 kg was the same as that for the reference population of 60–70 kg, the value indicated on the chart would be 1.
Abbreviations: CI, confidence interval; CRCL, creatinine clearance; F, female; M, male; min, minute; y, years.

