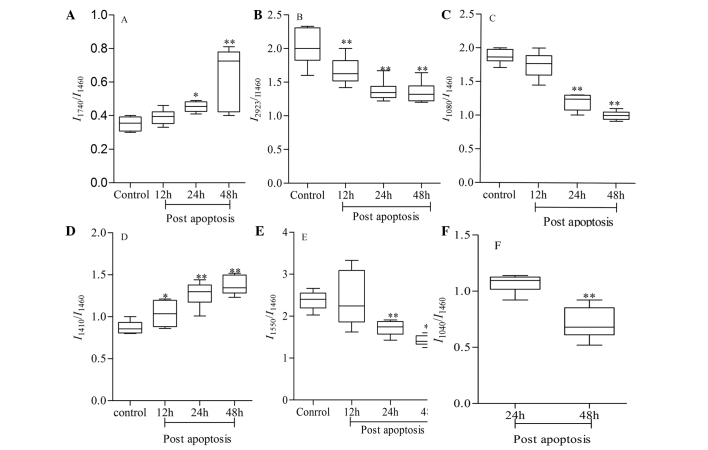
Figure 8.
Statistical analysis of Fourier transform infrared relative intensity ratios (/I1460) of the control SW620 cells and the cells treated with 5-fluorouracil for 12, 24 and 48 h using one-way analysis of variance. (A) I1740/I1460, (B) I2923/I1460, (C) I1080/I1640, (D) I1410/I1640, (E) I1550/I1640 and (F) I1040/I1640. Boxes and error bars represent median, interquartile range and range, respectively.*P<0.05, compared with the control; **P<0.001, compared with 12 and 24 h.

