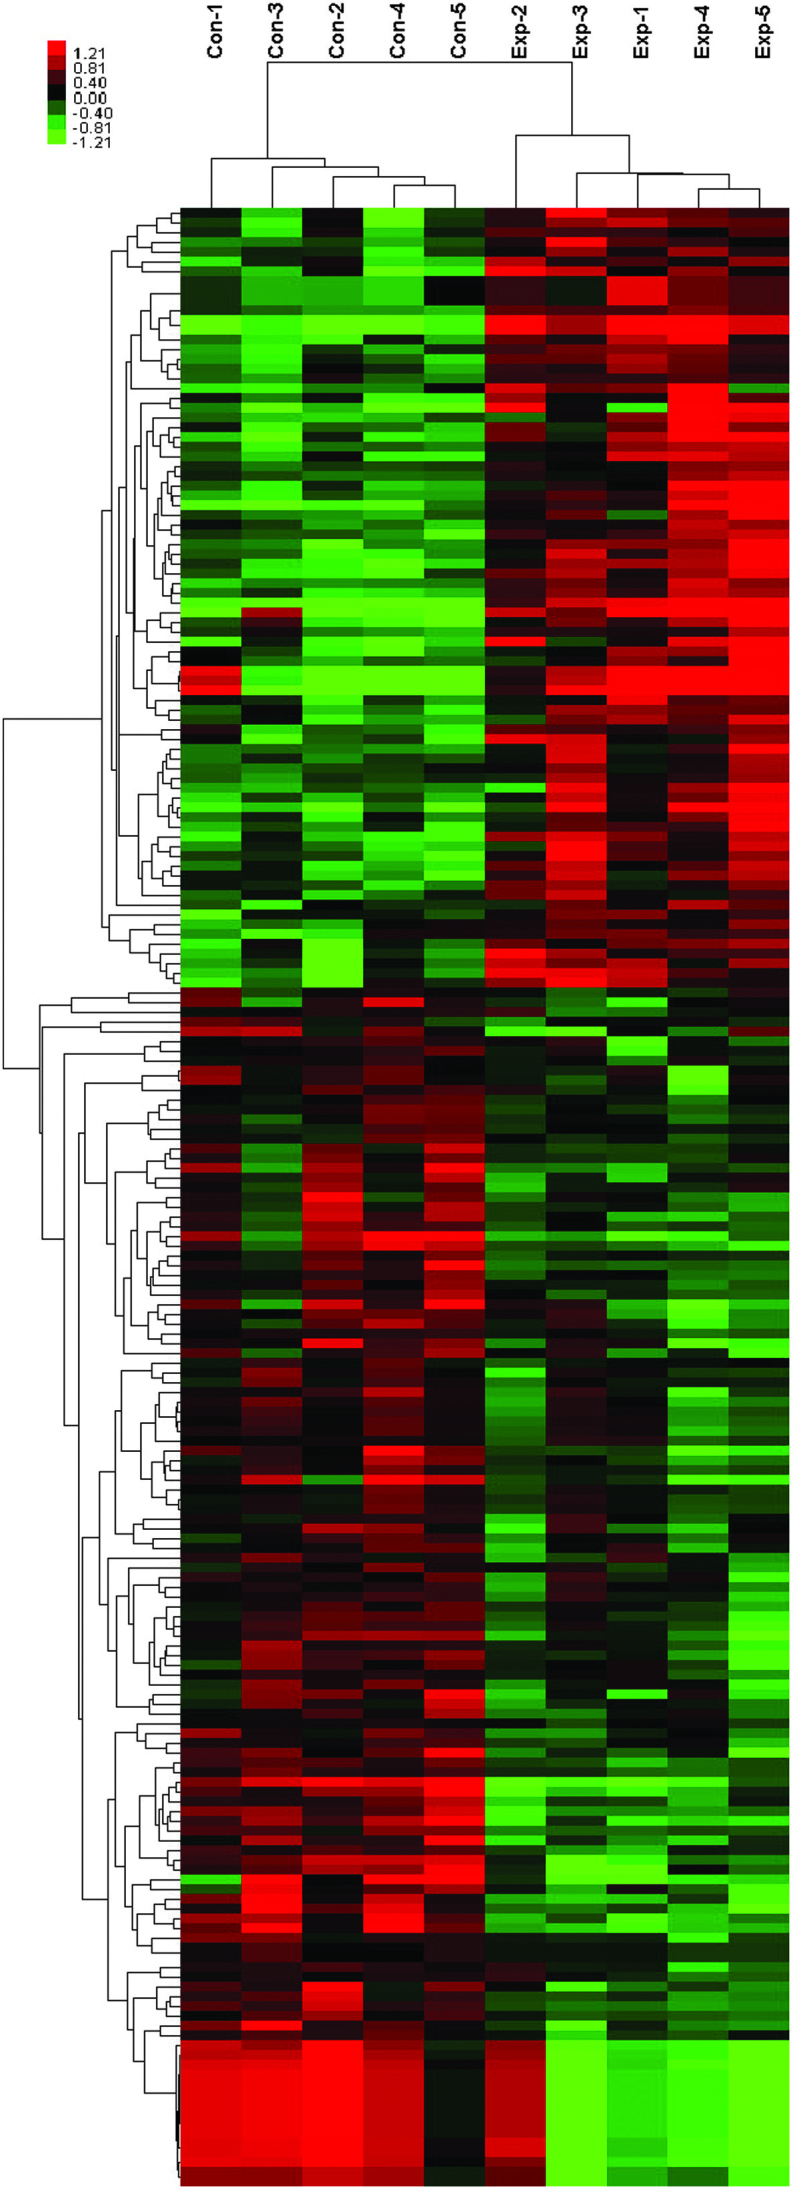
Figure 1.

Unsupervised classification of samples from chronic thromboembolic pulmonary hypertension patients and healthy controls, based on long noncoding RNA expression profiling. The data are depicted as a data matrix with rows representing the probes and columns representing the samples. The expression levels are presented according to the color scale shown at the top. Red and green indicate the expression levels above and below the median, respectively. The magnitude of deviation from the median is represented by the color saturation. Con, control group; Exp, experimental group.
