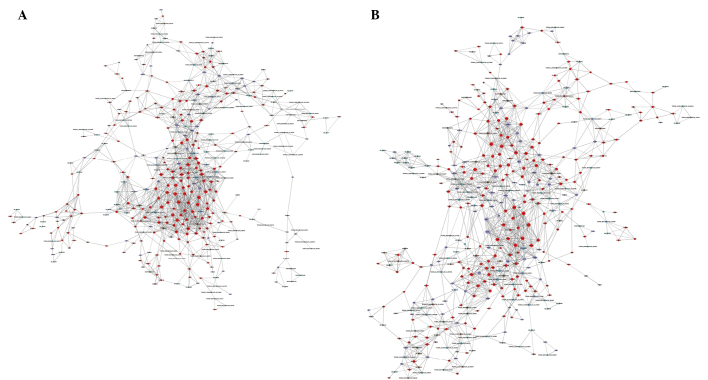
Figure 2.
Coding-noncoding gene coexpression network of (A) chronic thromboembolic pulmonary hypertension and (B) normal control groups. Blue represents downregulation and red represents upregulation. Circle nodes represent messenger RNA (mRNA), while rim nodes represent long noncoding RNA (lncRNA). Solid lines represent a positive regulatory association and dashed lines represent a negative regulatory association between lncRNA and mRNA.

