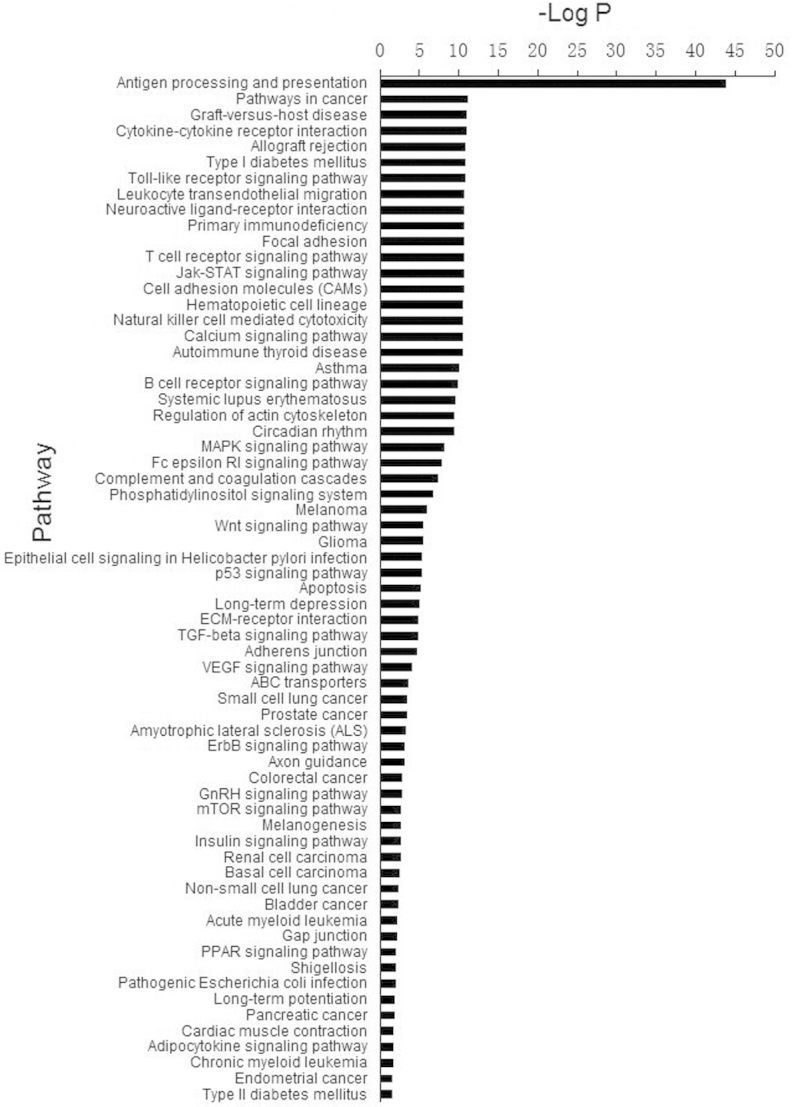
Figure 3.

Histogram of signaling pathways that were found to be significantly different between the chronic thromboembolic pulmonary hypertension and normal control groups. −log P, negative logarithm of P-value (larger −log P values indicate smaller P-values).
