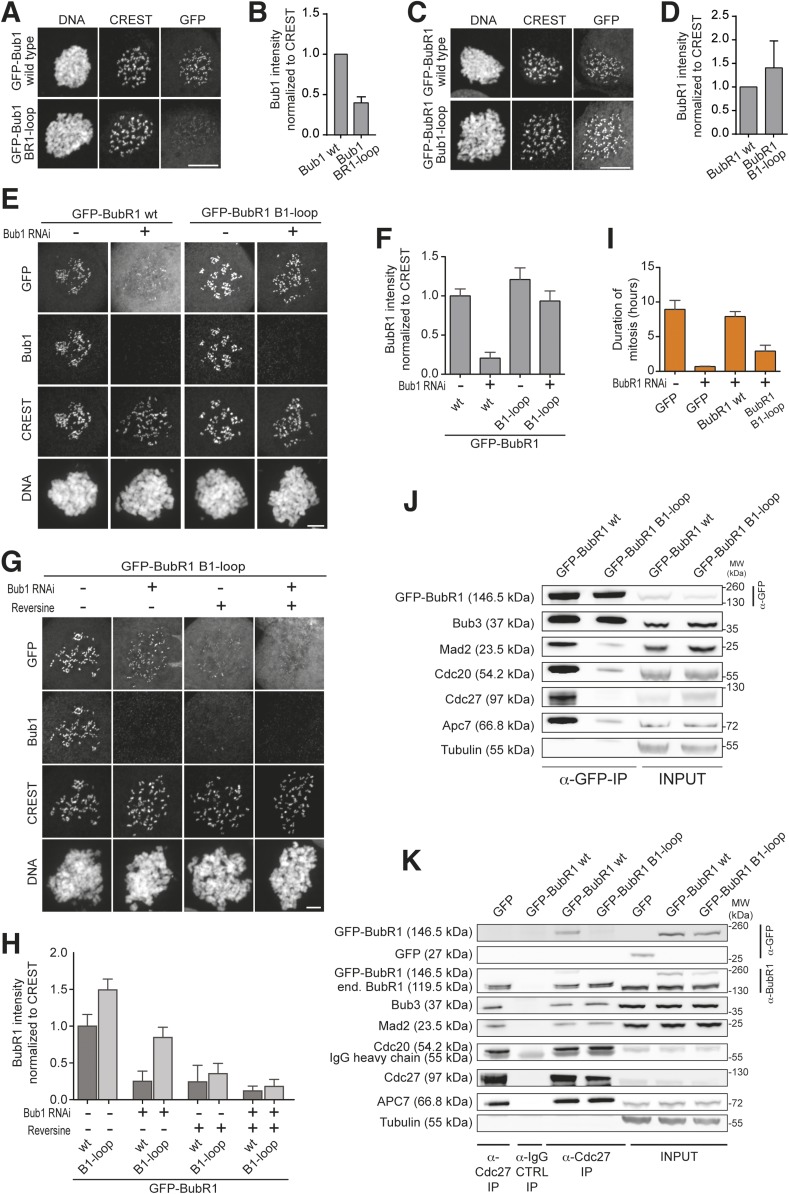
Figure 3. Behavior of the ‘loop swap’ mutants in HeLa cells.
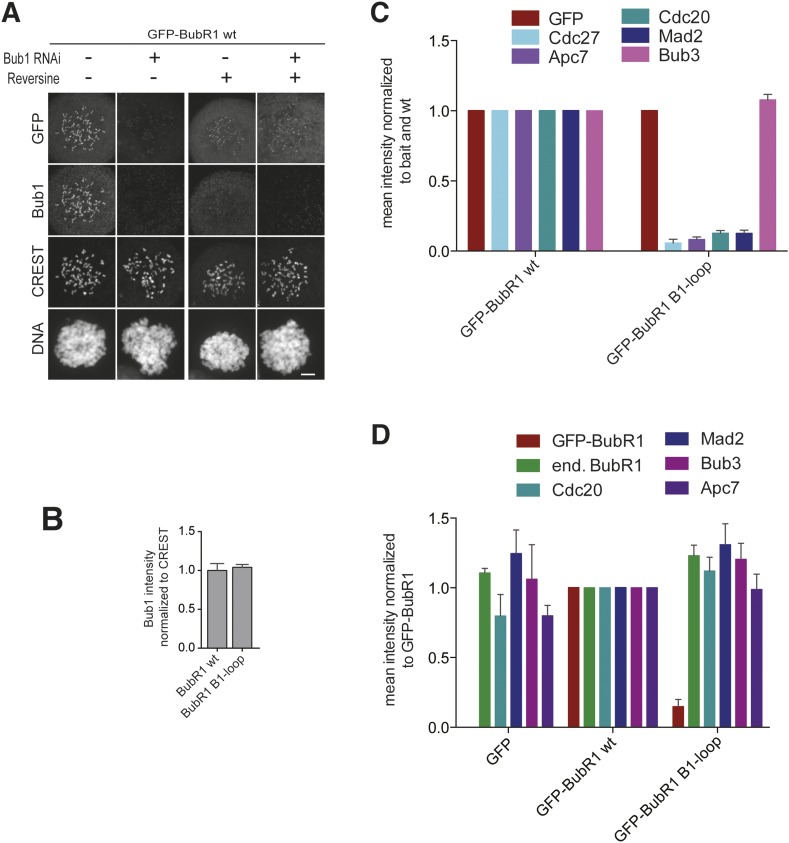
(A) Representative images of stable Flp-In T-REx cells expressing either GFP-Bub1 wild type (wt) or the loop mutant showing that the BR1-loop impairs KT localization. Scale bar: 10 µm. (B) Quantification of Bub1 KT levels in cells treated as in panel A. The graph shows mean intensity from three independent experiments. Error bar represents SEM. Values for Bub1 wt are set to 1. (C) Representative images of stable Flp-In T-REx cells expressing either GFP-BubR1 wt or the loop mutant showing that the B1-loop enhances KT localization. Scale bar: 10 µm. (D) Quantification of BubR1 KT levels in cells treated as in panel C. The graph shows mean intensity from three independent experiments. Error bar represents SEM. Values for BubR1 wt are set to 1. (E) Representative images of HeLa cells transfected with the indicated GFP-BubR1 constructs, showing that BubR1 B1-loop is independent of Bub1 for its KT localization. In brief, after transfection, cells were depleted of endogenous Bub1 by RNAi, synchronized with a double thymidine block and arrested in mitosis with nocodazole. Scale bar: 10 µm. (F) Quantification of BubR1 KT levels in cells treated as in panel E. The graph shows mean intensity from three independent experiments. Error bars represent SEM. Values for BubR1wt in non-depleted cells are set to 1. (G) Representative images of HeLa cells transfected with GFP-BubR1 B1-loop treated as in panel E in the presence (+) or absence (−) of the Mps1 inhibitor Reversine, showing that BubR1 B1-loop KT localization is dependent on Mps1. Scale bar: 10 µm. (H) Quantification of BubR1 KT levels in cells treated as in panel G. The graph shows mean intensity from two independent experiments. Error bars represent SEM. Values for BubR1wt in non-depleted cells without Reversine (images are shown in Figure 3—figure supplement 1, panel A) are set to 1. (I) Mean duration of mitosis of Flp-In T-REx stable cell lines expressing GFP-BubR1 wt or the loop mutant in the absence of endogenous BubR1 and in the presence of 50 nM nocodazole. Cell morphology was used to measure entry into and exit from mitosis by time-lapse-microscopy (n > 58 per cell line) from three independent experiments. Error bars depict SEM. (J) Western Blot of immunoprecipitates (IP) from mitotic Flp-In T-REx cell lines expressing the indicated GFP-BubR1 constructs showing the influence of the loop on the ability to pull down MCC and APC/C components. Tubulin was used as loading control. (K) Western Blot of immunoprecipitates (IP) of the APC/C subunit Cdc27 from mitotic Flp-In T-REx cell lines expressing the indicated GFP-BubR1 constructs showing the influence of the loop on the incorporation into APC/C-bound MCC. Tubulin was used as loading control.


