. 2015 Jan 22;4:e05269. doi: 10.7554/eLife.05269

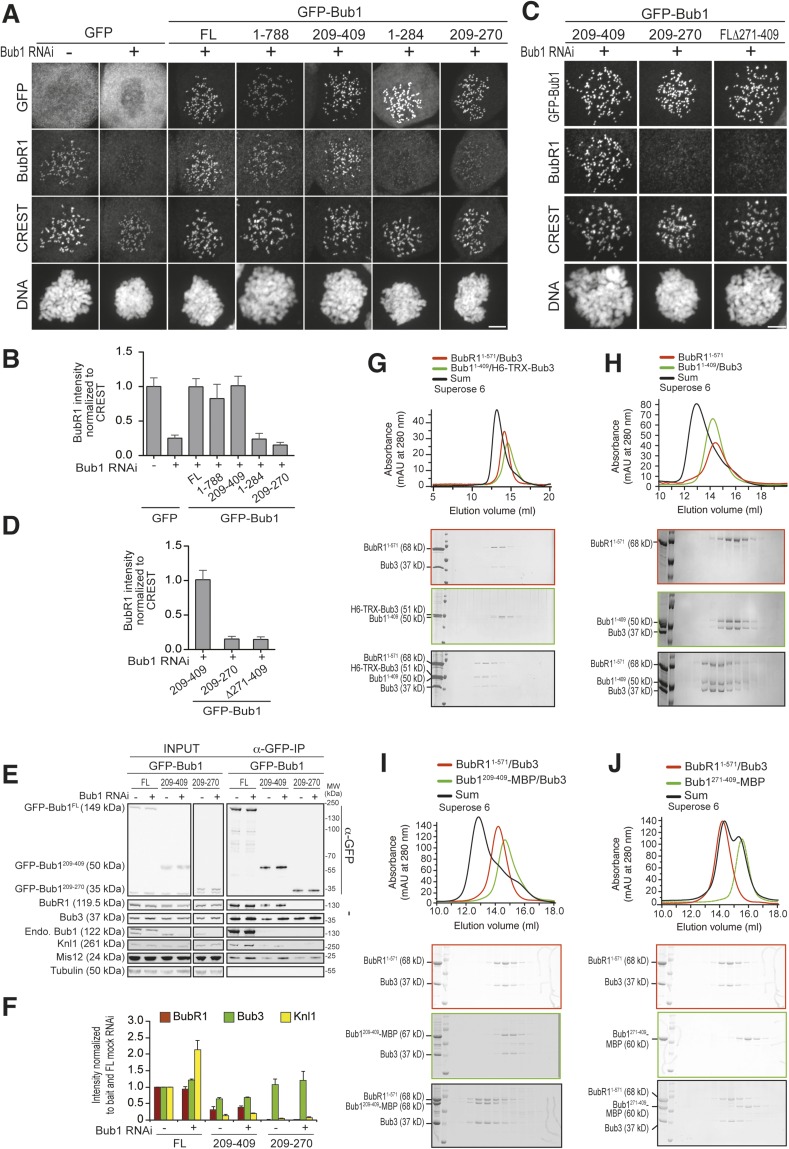
Figure 4. A minimal BubR1-binding region of Bub1.

(A and C) Representative images of stable Flp-In T-REx cell lines expressing the indicated GFP-Bub1 constructs after treatment with nocodazole, showing that Bub1209–409 is sufficient to recruit BubR1 (panel A) and that residues 271–409 are essential for this function (panel C). Scale bar: 10 µm. (B and D) Quantification of BubR1 KT levels in cells treated as in panels B and D, respectively. The graphs show mean intensity of two independent experiments, the error bars indicate SEM. The mean value for non-depleted cells expressing GFP (panel B) or GFP-Bub1209–409 (panel D) is set to 1. (E) Western blot of immunoprecipitates (IP) from mitotic Flp-In T-REx cell lysates expressing the indicated GFP-Bub1 constructs in the presence or absence of endogenous Bub1, showing that Bub1209–409 is sufficient to pull down BubR1. Tubulin was used as loading control. (F) Quantification of the Western blot in panel E. The amounts of co-precipitating BubR1, Bub3, and Knl1 were normalized to the amount of GFP-Bub1 bait present in the IP. Values for GFP-Bub1 FL in non-depleted cells are set to 1. The graph shows mean intensity of two independent experiments. Error bars represent SD. (G) BubR11–571/Bub3 and Bub11–409/Bub3 interact in size exclusion chromatography, which separates proteins based on size and shape. H6 and TRX are tags used for protein purification and expression. (H) BubR11–571 and Bub11–409/Bub3 interact in size exclusion chromatography. (I) BubR11–571/Bub3 and Bub1209–409/Bub3 interact in size exclusion chromatography. (J) BubR11–571/Bub3 and Bub1271–409 do not interact in size exclusion chromatography. MBP—maltose binding protein, mAu—milliabsorbance unit.

DOI: http://dx.doi.org/10.7554/eLife.05269.009

Figure 4.

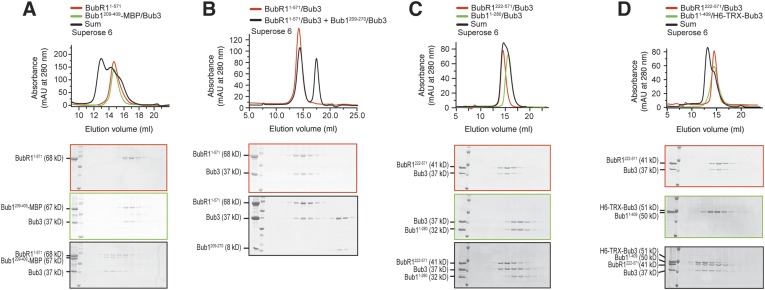
Figure 4—figure supplement 1. Additional chromatographic experiments.

Figure 4—figure supplement 1.

(A) BubR11–571 and Bub1209–409/Bub3 interact in size exclusion chromatography. (B) BubR11–571/Bub3 and Bub1209–270/Bub3 do not interact in size exclusion chromatography. The control run of Bub1209–270/Bub3 is missing due to limiting amounts of the protein. (C) BubR1222–571/Bub3 and Bub11–280/Bub3 do not interact in size exclusion chromatography. (D) BubR1222–571/Bub3 and Bub11–409/Bub3 interact in size exclusion chromatography. mAU—milliabsorbance unit.
Figure 4—figure supplement 2. The TPR domain of Bub1 influences KT binding affinity in addition to the loop region.

Figure 4—figure supplement 2.

(A) Representative images of HeLa cells transfected with the indicated GFP-Bub1FL constructs, showing that the BR1-loop impairs KT localization. However in the absence of endogenous Bub1 considerable binding affinity is regained. Cells were treated as described in Figure 3E. Scale bar: 10 µm. (B) Representative images of HeLa cells transfected with the indicated GFP-Bub1209–409 constructs, showing that this construct, which lacks the N-terminal TPR domain, does not regain considerable binding affinity in the absence of Bub1. Cells were treated as described in Figure 3E. Scale bar: 10 µm. (C) Representative images of HeLa cells transfected with the indicated GFP-Bub11–409 constructs, showing that the TPR domain is contributing to regaining KT binding affinity in the absence of endogenous Bub1. Cells were treated as described in Figure 3E. Scale bar: 10 µm. (D) Quantification of Bub1 KT levels in cells treated as in panels AC. The graph shows mean intensity from two independent experiments. Error bars represent SEM. Values for Bub1FL in non-depleted cells were set to 1.
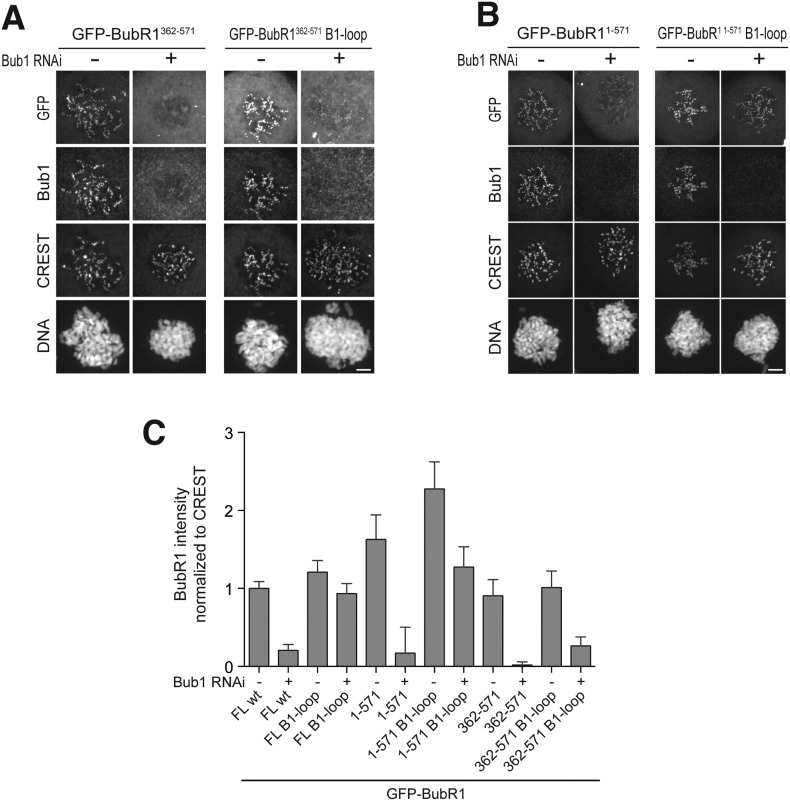
Figure 4—figure supplement 3. The TPR domain of BubR1 influences kinetochore binding affinity in addition to the loop region.

Figure 4—figure supplement 3.

(A) Representative images of HeLa cells transfected with the indicated GFP-BubR1362–571 constructs, showing that the B1-loop enhances kinetochore localization. However in the absence of endogenous Bub1 the short loop mutant, which lacks the N-terminal TPR domain, is less efficient than the full-length BubR1 in its localization to kinetochores (Figure 3E). Cells were treated as described in Figure 3E. Scale bar: 10 µm. (B) Representative images of HeLa cells transfected with the indicated GFP-BubR11–571 constructs, showing that the TPR domain is contributing together with the loop region to the ability to stay at KTs in the absence of endogenous Bub1. Cells were treated as described in Figure 3E. Scale bar: 10 µm. (C) Quantification of BubR1 KT levels in cells treated as in (AB). The graph shows mean intensity from at least two independent experiments. Error bars represent SEM. Values for BubR1FL in non-depleted cells are set to 1.