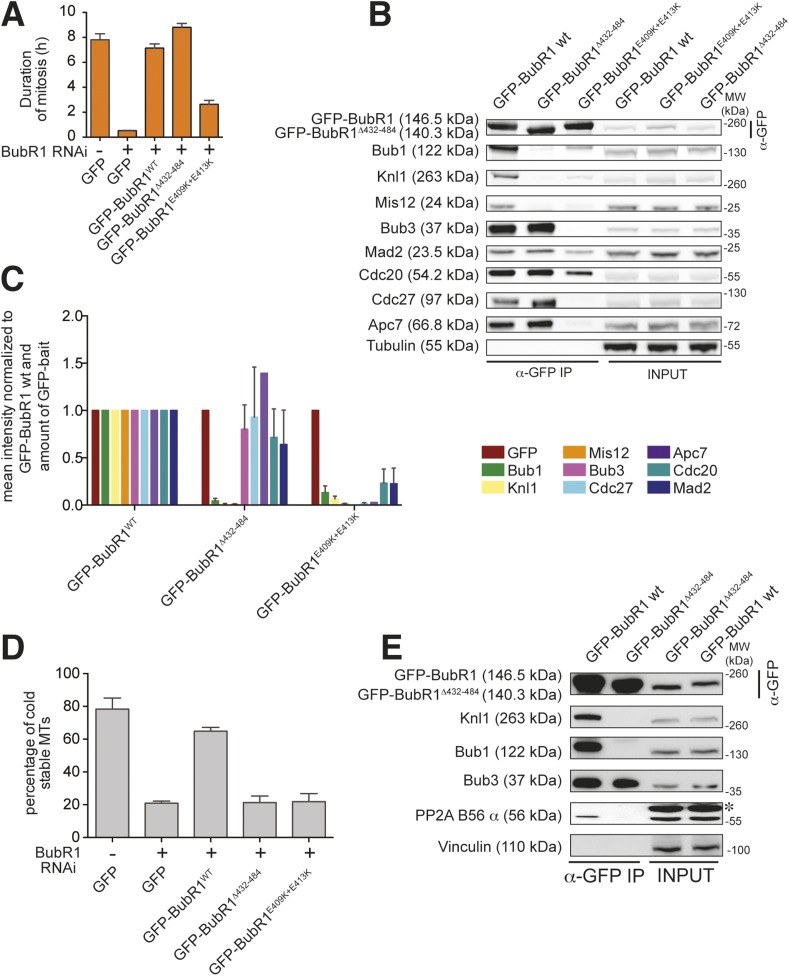
Figure 7. Functional characterization of BubR1 mutants.
(A) Mean duration of mitosis of Flp-In T-REx stable cell lines expressing GFP-BubR1 wt or the indicated mutants in the absence of endogenous BubR1 and in the presence of 50 nM nocodazole. Cell morphology was used to measure entry into and exit from mitosis by time-lapse-microscopy (n > 44 per cell line per experiment) from at least three independent experiments. Error bars depict SEM. (B) Western blot of immunoprecipitates (IP) from mitotic Flp-In T-REx cell lines expressing the indicated GFP-BubR1 constructs. Tubulin was used as loading control. (C) Quantification of the Western Blot in Figure 7B. The amounts of co-precipitating proteins were normalized to the amount of GFP-BubR1 bait present in the IP. Values for GFP-BubR1 wt are set to 1. The graphs show mean intensity of two independent experiments. Error bars represent SEM. (D) Analysis of cold-stable microtubules in cells expressing the indicated GFP-BubR1 constructs. (E) Western Blot of immunoprecipitates (IP) from mitotic Flp-In T-REx cell lines expressing the indicated GFP-BubR1 constructs. The asterisk represents an unspecific band recognized by the PP2A antibody.

