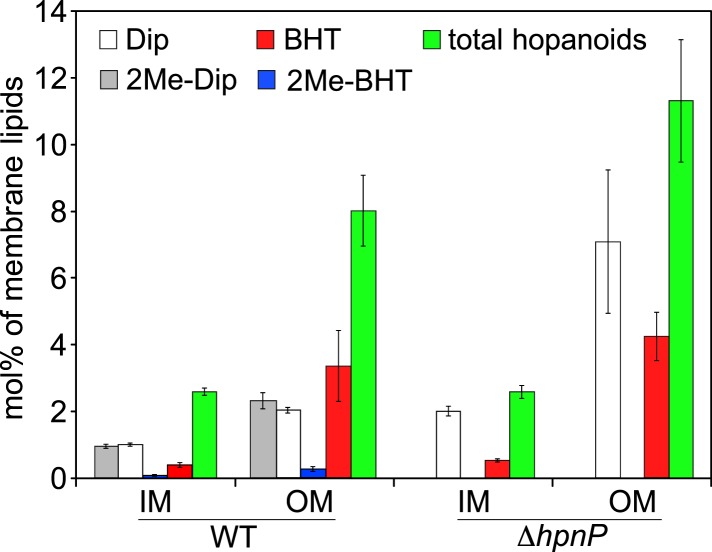
Figure 4. Molar percentage of hopanoids in the inner membrane (IM) and outer membrane (OM) of WT and ΔhpnP determined by GC–MS.
Error bars represent the standard deviation from three biological replicates. Total hopanoids = sum of (2Me)-Dip and (2Me)-BHT.

