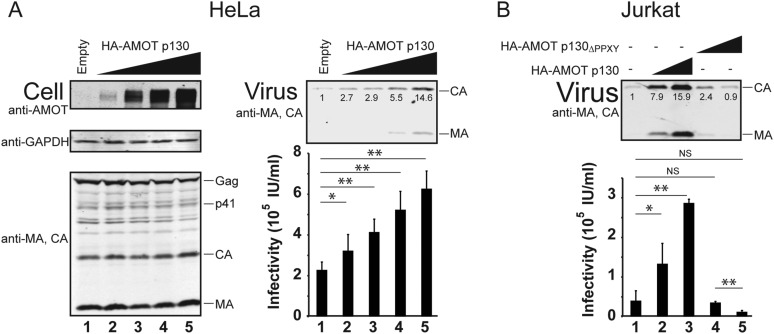
Figure 6. AMOT p130 stimulates release of HIV-1 from HeLa and Jurkat T cells.
(A) Left panels are western blots showing HeLa cellular levels of endogenous AMOT p130 and exogenous HA-AMOT p130 (panel 1, anti-AMOT), endogenous GAPDH (panel 2, anti-GAPDH, loading control) and HIV-1 Gag proteins (panel 3, anti-MA and anti-CA). HeLa cells were co-transfected with expression vectors for HIV-1 (lanes 1–5), and with increasing concentrations of an expression construct for HA-AMOT p130 (0–4 μg DNA in lanes 1–5). Right panels show corresponding levels of extracellular virion-associated Gag proteins (upper panel, western blot, anti-MA and anti-CA) and viral titers (lower panel), n = 4. (B) Levels of extracellular virion-associated Gag proteins (upper panel, western blot, anti-MA and anti-CA) and viral titers (lower panel). Jurkat T cells were co-transfected with expression vectors for HIV-1 (lanes 1–5), together with a control vector (lane 1) or expression vectors for wild type HA-AMOT p130 (lanes 2 and 3, 5 and 10 µg DNA respectively) or an HA-AMOT p130ΔPPXY protein with inactivating point mutations in the three PPXY motifs (lanes 4 and 5, 5 and 10 µg DNA respectively), n = 3.


