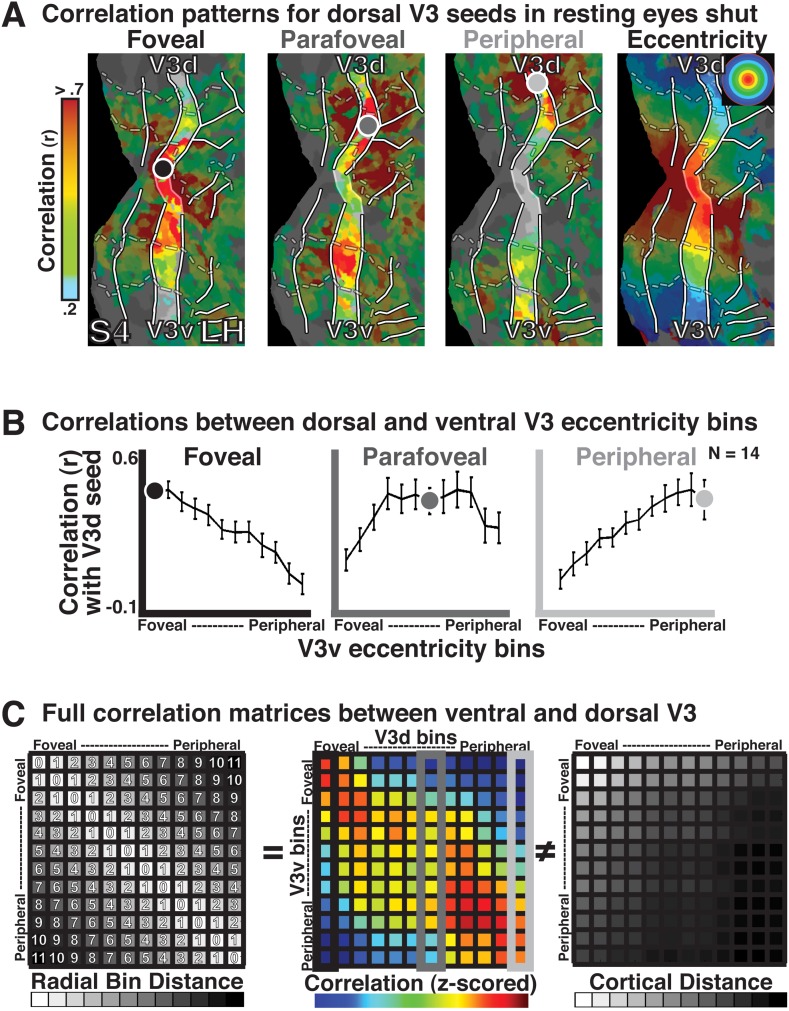
Figure 4. Illustration of eccentricity binning correlations on resting state.
(A) Correlation maps in left hemisphere of subject S4 for 3 seed bin locations (<0.5–0.84°, 3.71–4.63°, 10.36–12.50°; left to right) in dorsal V3 and subject S4's eccentricity map (right). Grayscale dots mark approximate seed bin locations. (B) Correlations with all ventral V3 bins are plotted for the three dorsal seed locations. The strongest correlations between dorsal and ventral V3 were at, and around, iso-eccentricity representations. (C) The entire correlation matrix for all eccentricity locations between dorsal and ventral V3 (center) revealed a similar pattern where correlations were strongest at or near iso-eccentricity (i.e., the diagonal), and weaker for bins with large radial distances (e.g., foveal vs peripheral-most). Radial distance (left) was strongly correlated with the measured group connectivity (r = 0.84) and was uncorrelated to the cortical distance (right).

