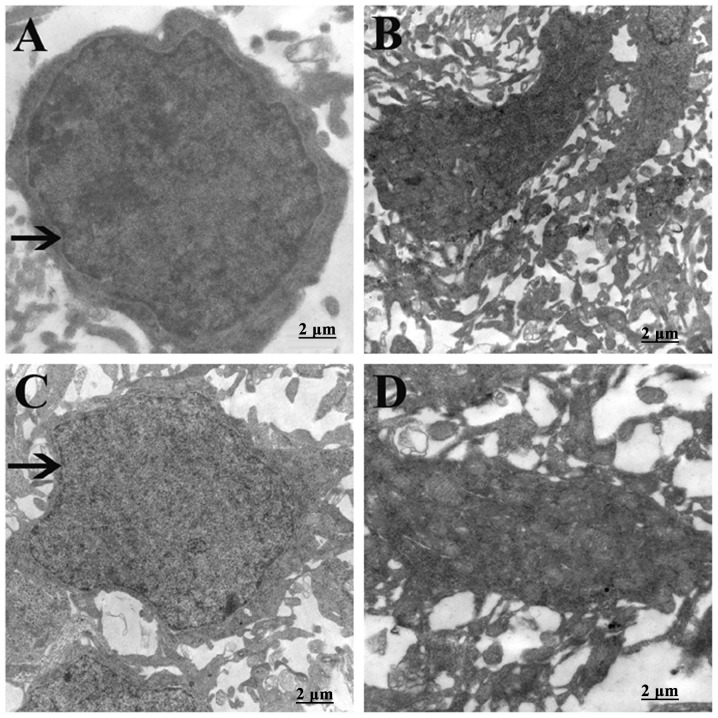
Figure 2.
Observation of the effects of hypoxia-ischemia (HI) on oligodendrocytes (OLs) by transmission electron microscopy (magnification, ×25,000). (A and C) In the normoxia group, the morphology and structure of OLs is visible, with a large, full nucleus, and a complete nuclear membrane, indicated by arrows. (B) In the HI group, the cell morphology and structure is highly irregular, with cell atrophy observed, altered nuclear structure, and cell necrosis at day 3. (D) By day 21, the OLs have obtained an irregular structure and show serious cell degeneration and necrosis.

